Fig. 3
Fig. 3
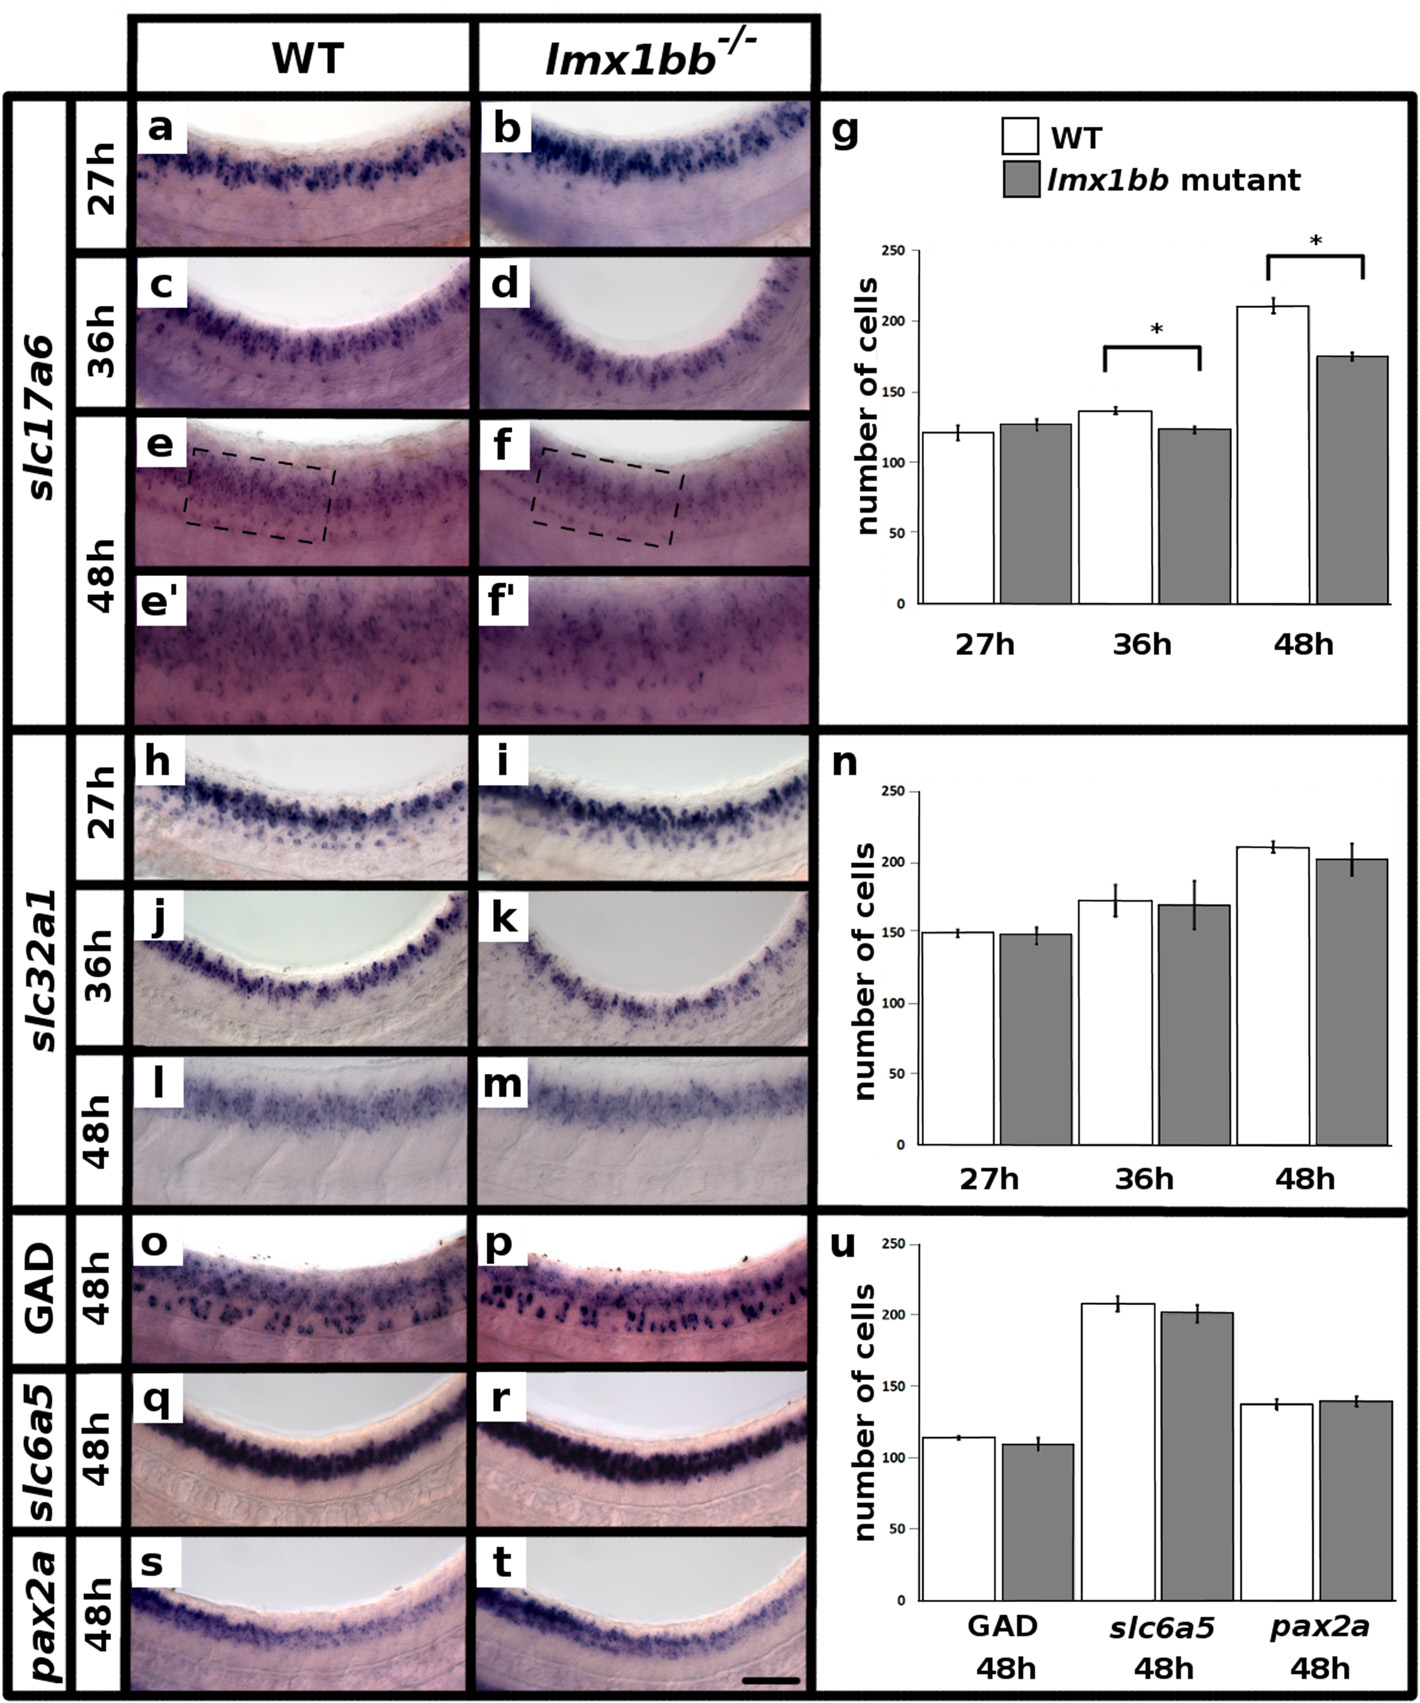
lmx1bb is required for glutamatergic phenotypes at later developmental stages but does not repress inhibitory phenotypes. Lateral view of zebrafish spinal cord at 27 h (a, b, h and i), 36 h (c, d, j and k) and 48 h (e-f′, l, m and o-t), anterior left, dorsal top. in situ hybridization for slc17a6a + slc17a6b (slc17a6) (a-f′), slc32a1 (h-m), gad1b + gad2 (GAD) (o, p), slc6a5 (q and r) and pax2a (s and t). (e′ and f′) are magnified views of black dashed box region in (e and f) respectively. Mean number of cells (y-axis) expressing markers slc17a6 (g), slc32a1 (n) and GAD, slc6a5 or pax2a at 48 h (u) in spinal cord region adjacent to somites 6?10 in WT embryos (white) and lmx1bb homozygous mutants (grey) (x-axis). Statistically significant (p < 0.05) comparisons are indicated with square brackets and stars. Error bars indicate standard error of the mean. Two independent experiments were conducted for all slc17a6 and slc32a1 experiments (a-m). Cells count results were similar for each replicate. One experiment was conducted for (o-t). Cell count data presented here (g, n and u) are average values for 4 to 17 embryos from the same in situ hybridization experiment. Precise numbers of embryos counted and p values are provided in Tables 3 and 4. Scale bar = 50 Ám (a-f, h-m and o-t) and 25 Ám (e′ and f′)

