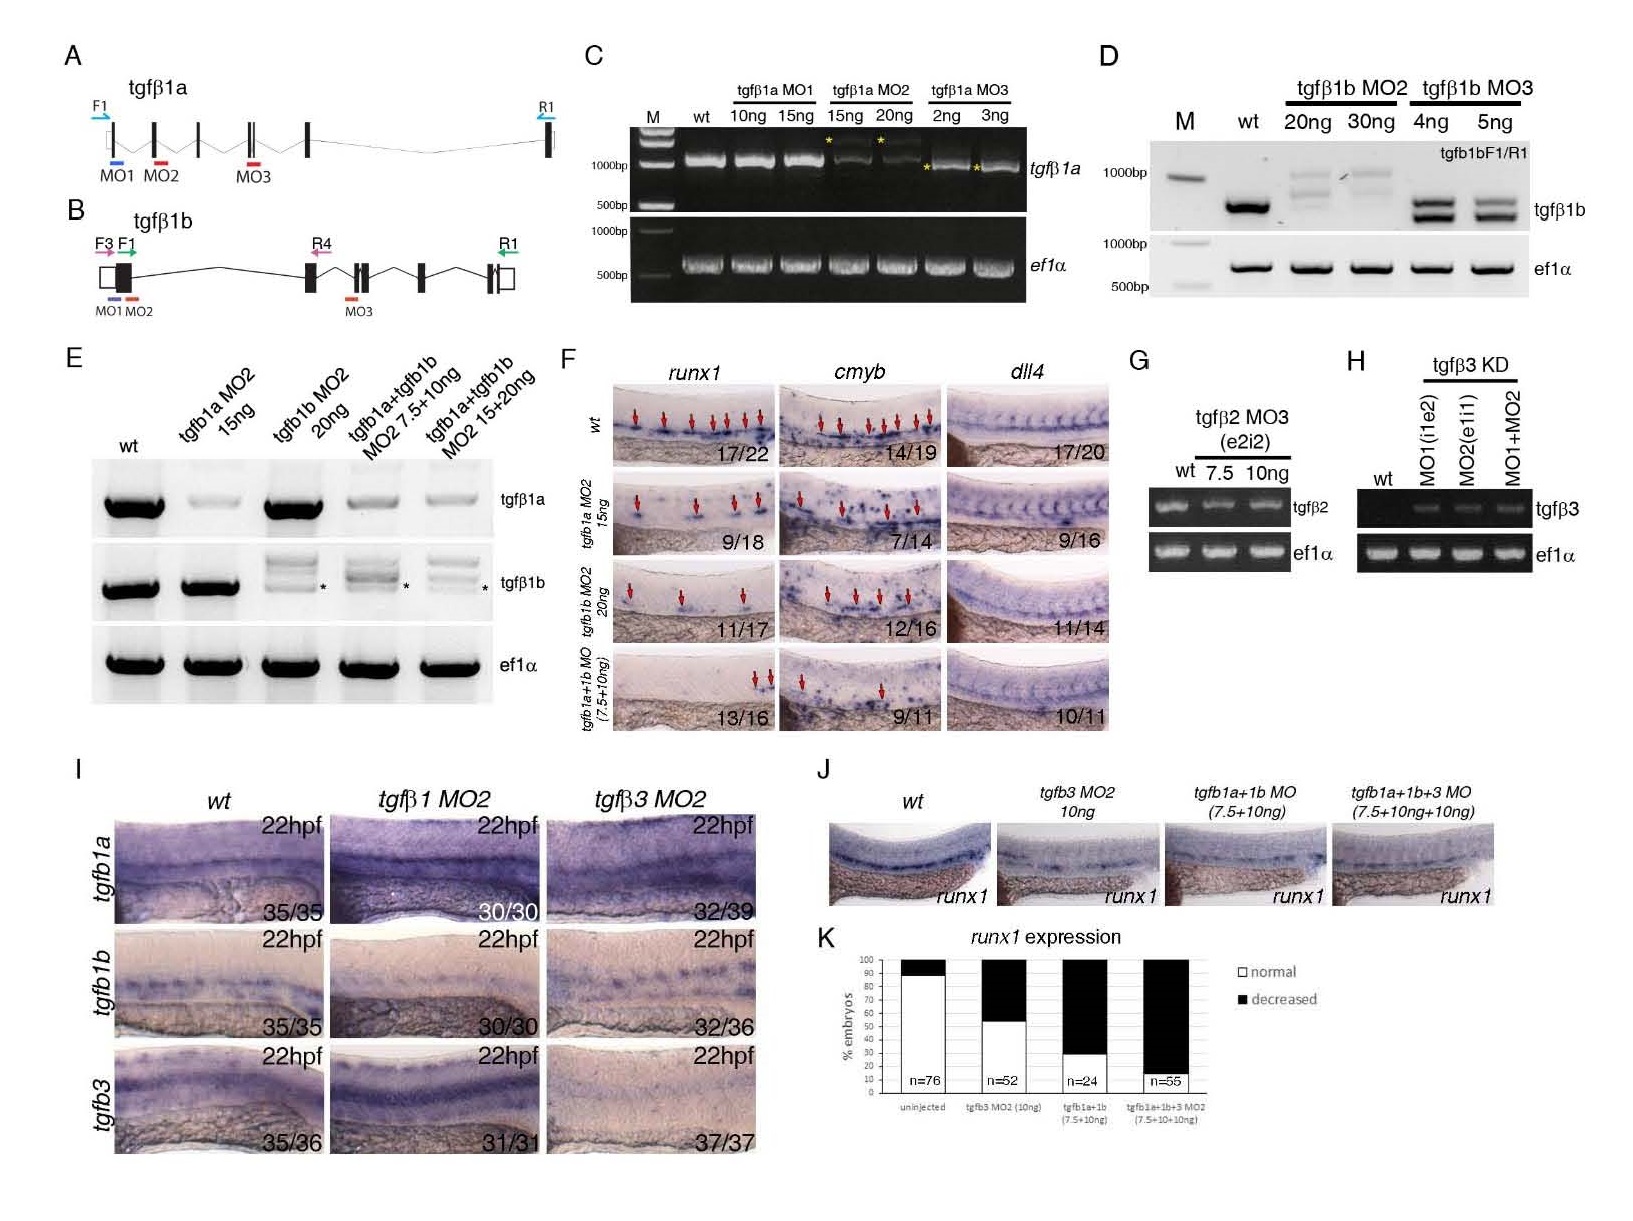
Fig. S3
Validation of morpholinos targeting tgfβ1a, tgfβ1b, tgfβ2 and tgfβ3 and further characterization of the phenotype. (A) Schematic representation of the genomic organization of the tgfb1a gene, location of morpholinos and primers used to validate morpholino activity. (B) Schematic representation of the genomic organization of the tgfb1b gene, location of morpholinos and primers used to validate morpholino activity. (C) Validation of the activity of the tgfb1a morpholinos by PCR. Yellow asterisk marks PCR products generated as a result of aberrant splicing induced by the tgfb1a morpholinos MO2 and MO3. We have used tgfb1aMO2 in all of the subsequent analysis. (D) Validation by PCR of the activity of two antisense morpholinos targeting tgfb1b. Clear aberrant splicing was induced by tgfb1b morpholinos MO2 and MO3. We have used tgfb1bMO2 in all of the subsequent analysis. (E) Validation by PCR of the tgfb1aMO2+tgfb1bMO2 combination. Asterisk marks the remainder of the normally spliced tgfb1b gene product. (F) Testing the tgfb1a+tgfb1b MO2 combinations by in situ hybridisation against HE markers runx1, HSPC marker cmyb and arterial marker dll4 at 28hpf. The combination of tgfb1a+tgfb1b MO2 (referred to in the main text as tgfb1MO) was used at 7.5 ng/Ál +10ng/Ál throughout the manuscript. Numbers of embryos analysed are shown in each panel as number of affected embryos/total observed. (G) Validation by PCR of the activity of a morpholino targeting tgfb2. (H) Validation by PCR of the activity of two published morpholinos (Cheah et al, 2010) targeting tgfb3. Tgfb3MO2 was used in all of the subsequent analysis. (I) Expression of tgfb1a, tgfb1b and tgfb3 in tgfb1MO2 and tgfb3MO2 at 22hpf. tgfb1MO2 morphants show an increase in tgfb1a and tgfb3 and a decrease in tgfb1b; tgfb3MO2 morphants show a dramataic loss of tgfb3 expression. Numbers of embryos analysed are shown in each panel as number of affected embryos/total observed. (J,K) Comparison and quantification of the runx1 expression in the DA upon single tgfb3MO2, tgfb1MO2 or combined tgfb3MO2+tgfb1MO2, showing increased severity of the phenotype in the triple morphants as compared to single morphants. The numbers of embryos analysed are shown in the graph in (K).
Reprinted from Developmental Cell, 38(4), Monteiro, R., Pinheiro, P., Joseph, N., Peterkin, T., Koth, J., Repapi, E., Bonkhofer, F., Kirmizitas, A., Patient, R., Transforming Growth Factor ? Drives Hemogenic Endothelium Programming and the Transition to Hematopoietic Stem Cells, 358-70, Copyright (2016) with permission from Elsevier. Full text @ Dev. Cell

