Image
Figure Caption
Fig. S9
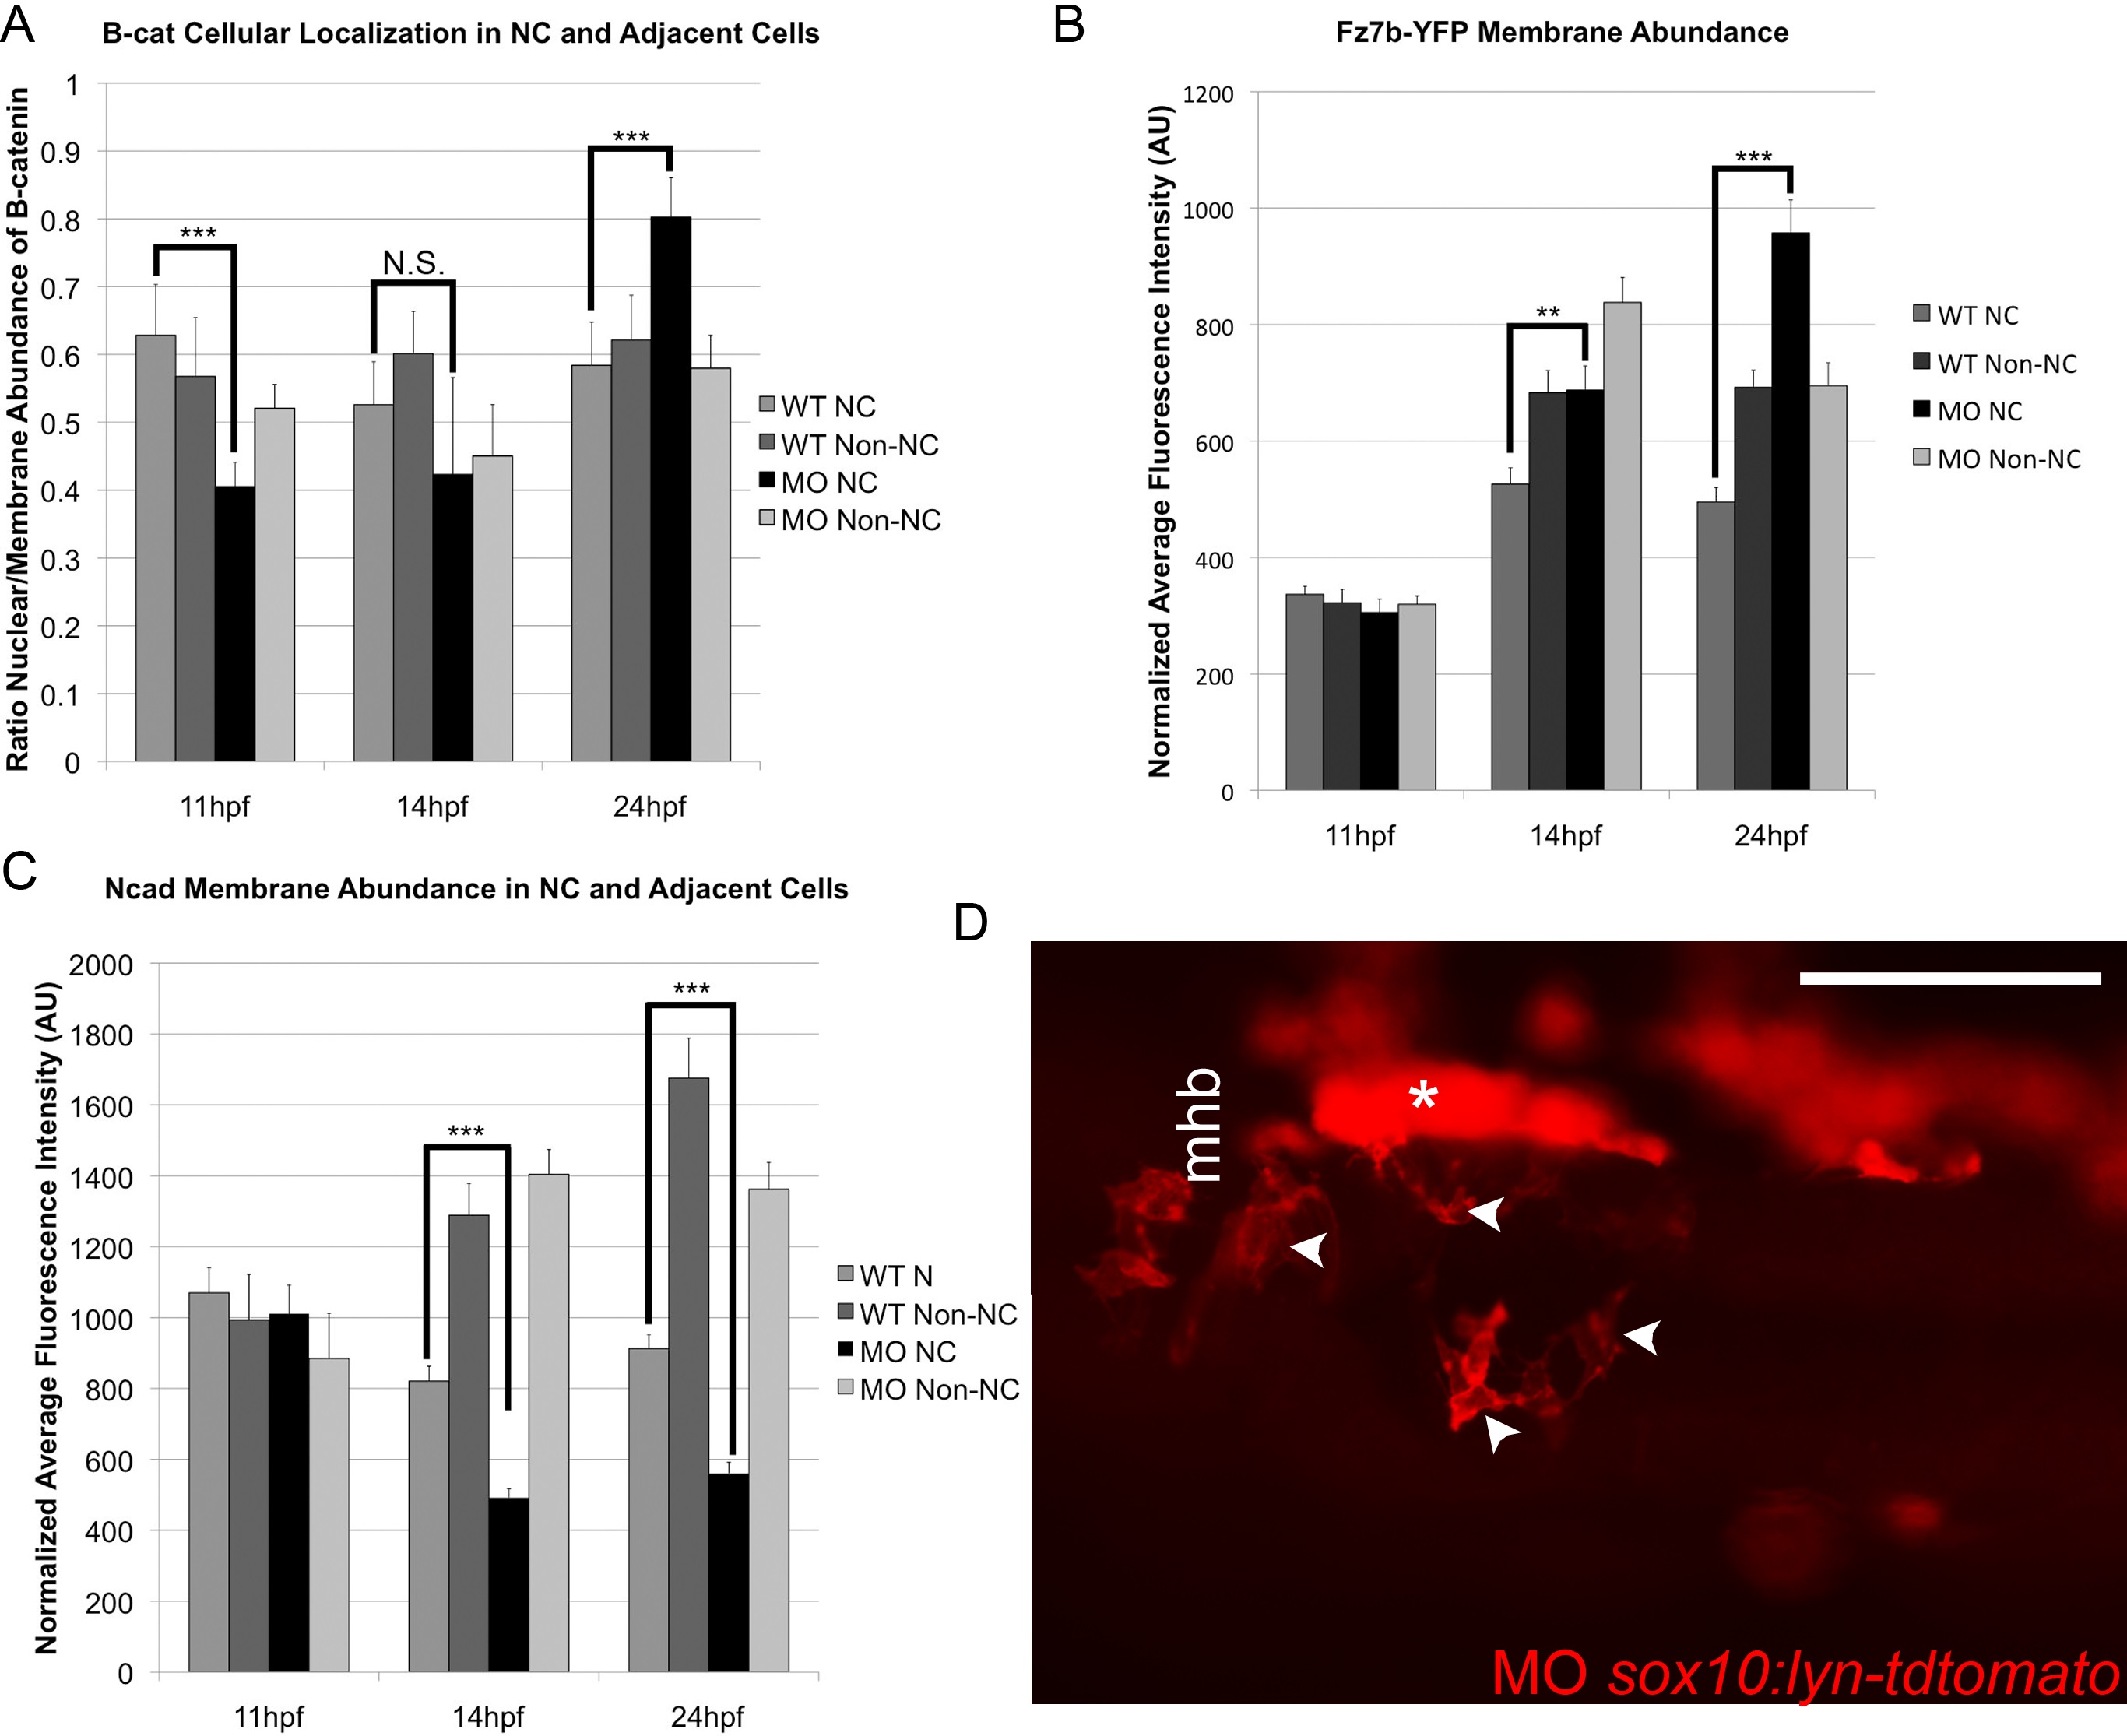
Cell autonomous effects of Rbc3a knockdown. (A-C) Quantification of subcellular localization of (A) Bcat, (B) Fz7b-YFP, and (C) Ncad in NC and non-NC cells. ** p<0.01, *** p<0.001, N.S., not significant. (D) Wild-type host embryo at 24 hpf with sox10:lyn-tdtomato cells (red) transplanted from a rbc3a-MO1-injected donor, dorsal view. A subset of rbc3a-deficient donor cells formed dorsal midline aggregates (white arrowheads), but many other cells migrated properly into the pharyngeal arches (asterisk). Mhb, mindbrain-hindbrain boundary. Scale bar, 100 Ám.
Acknowledgments
This image is the copyrighted work of the attributed author or publisher, and
ZFIN has permission only to display this image to its users.
Additional permissions should be obtained from the applicable author or publisher of the image.
Full text @ PLoS Biol.

