
Image
|
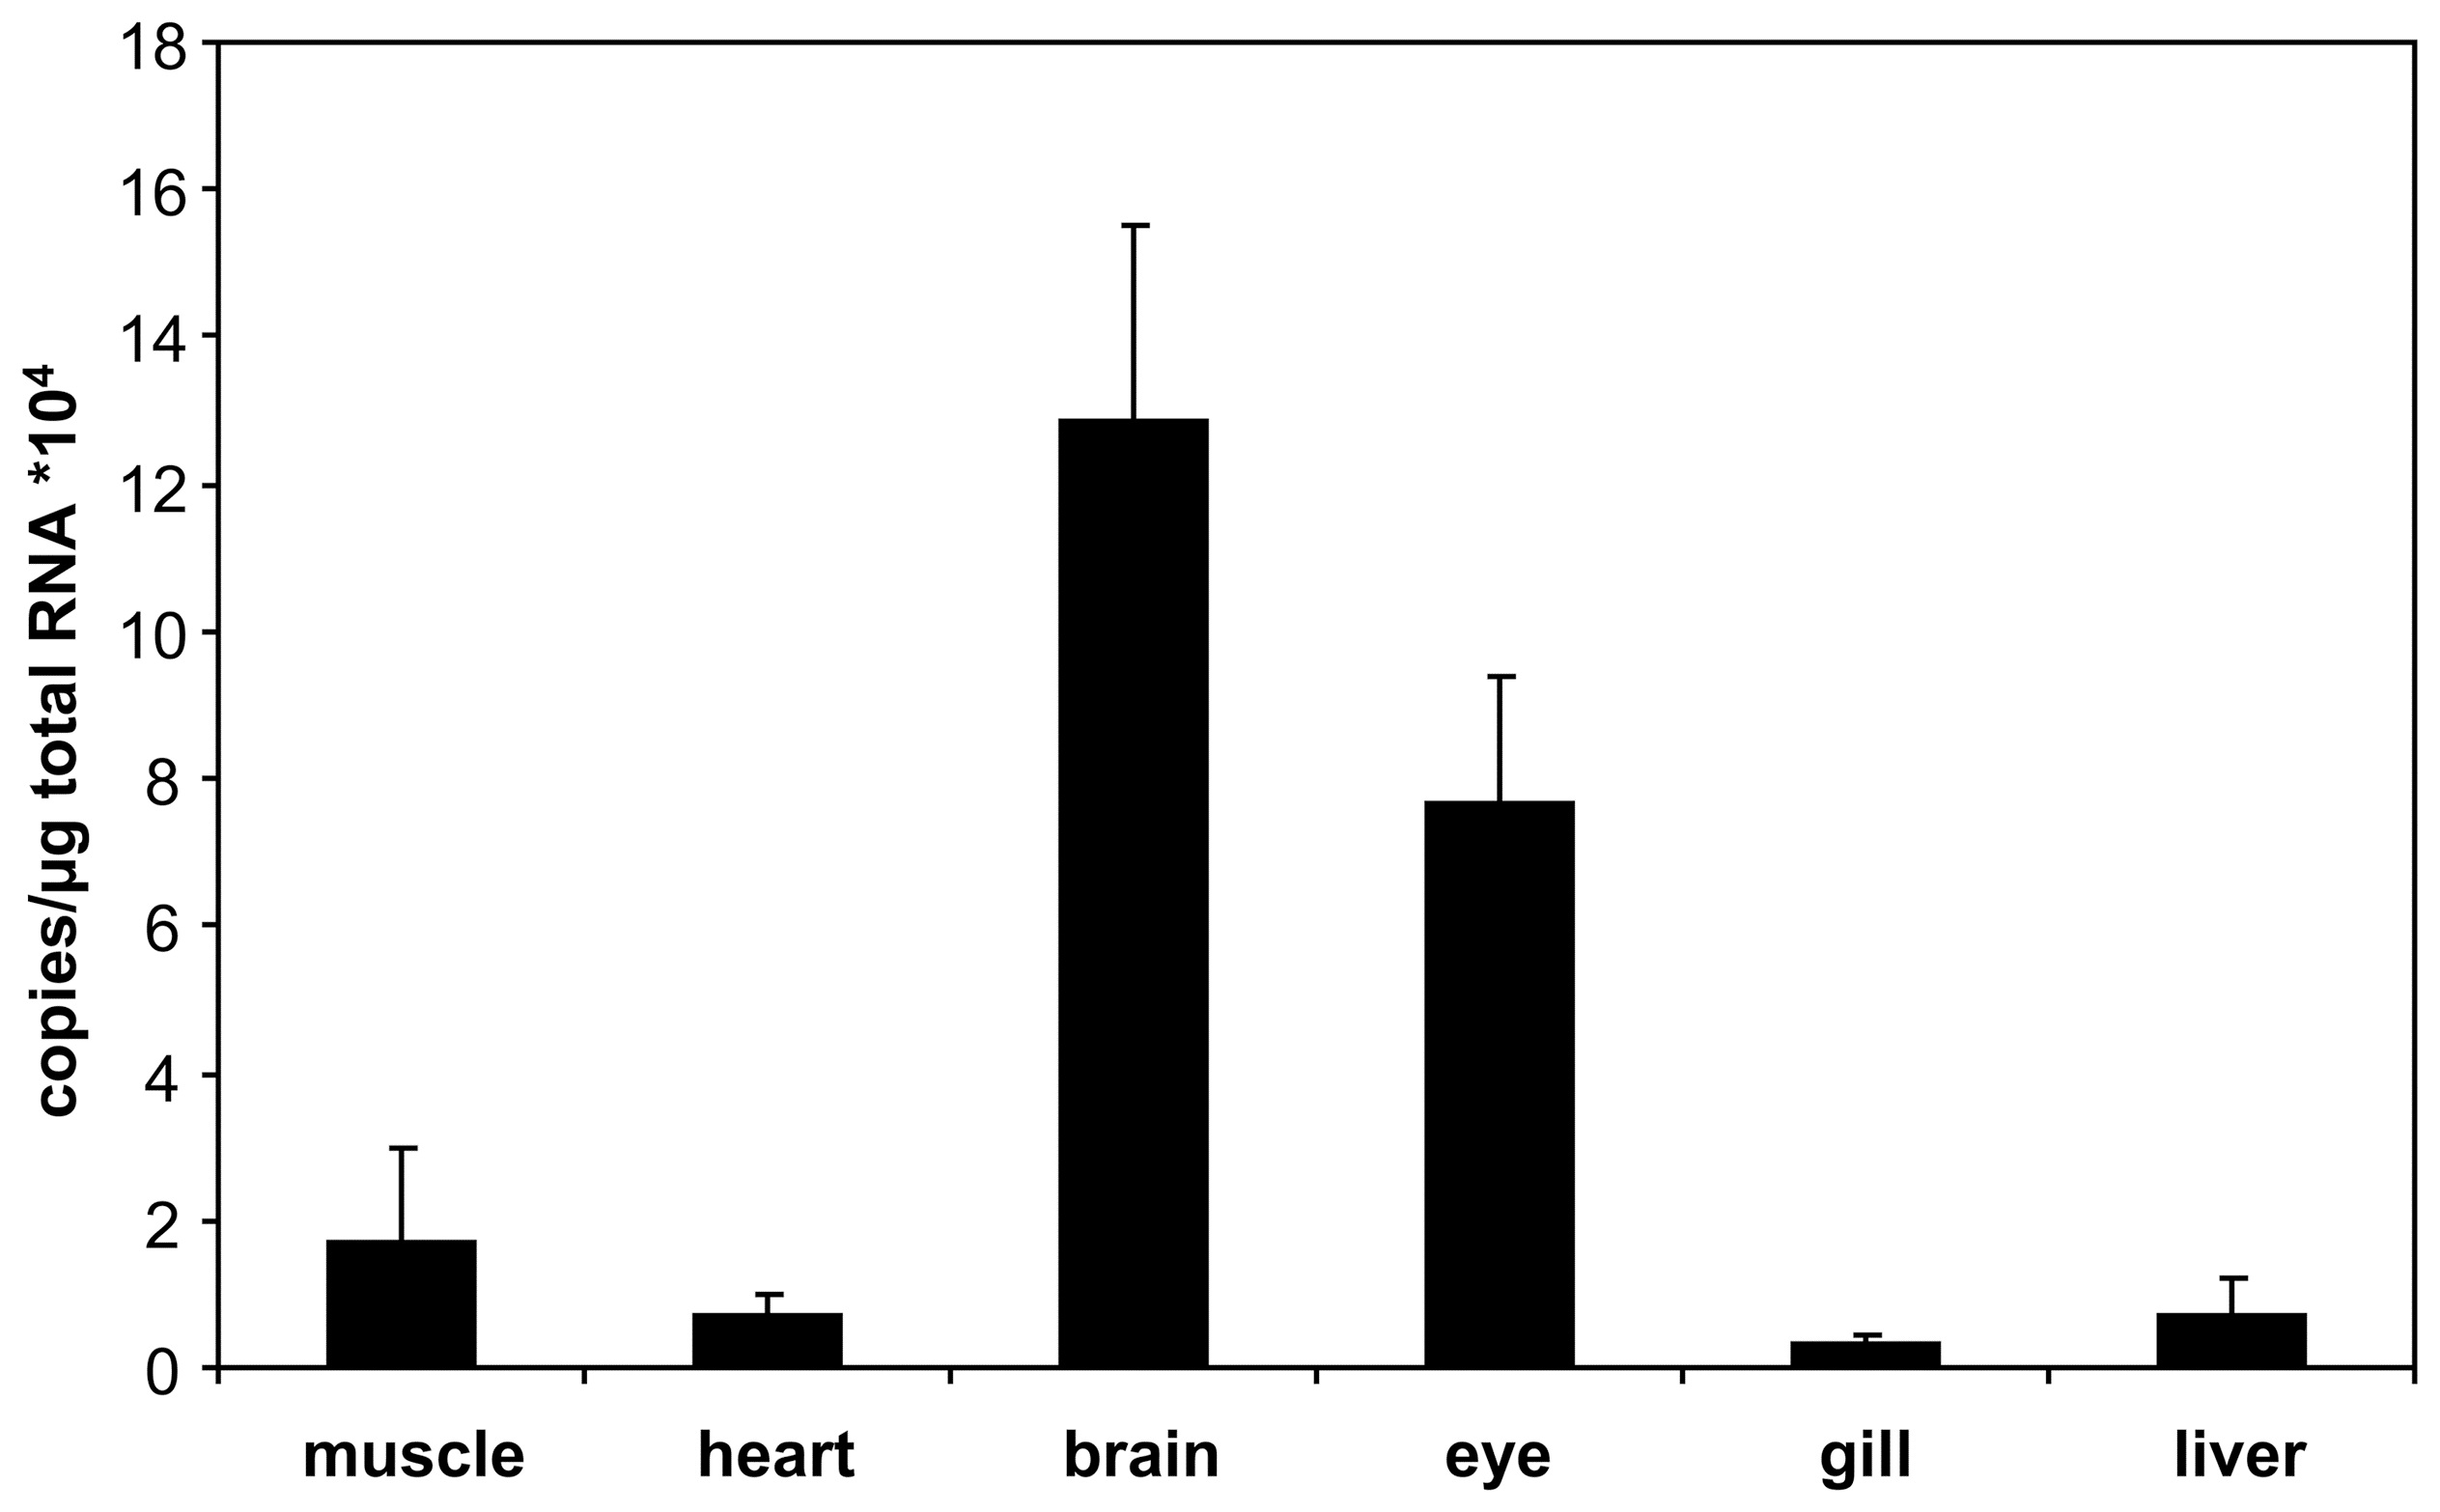
Figure Caption
Fig. 3
Expression of GbX in zebrafish.
GbX mRNA levels were measured by quantitative real-time RT-PCR. Tissues of three individuals were pooled. Values are means of three independent pools and the standard deviations are given.
Figure Data
Acknowledgments
This image is the copyrighted work of the attributed author or publisher, and
ZFIN has permission only to display this image to its users.
Additional permissions should be obtained from the applicable author or publisher of the image.
Full text @ PLoS One