
|
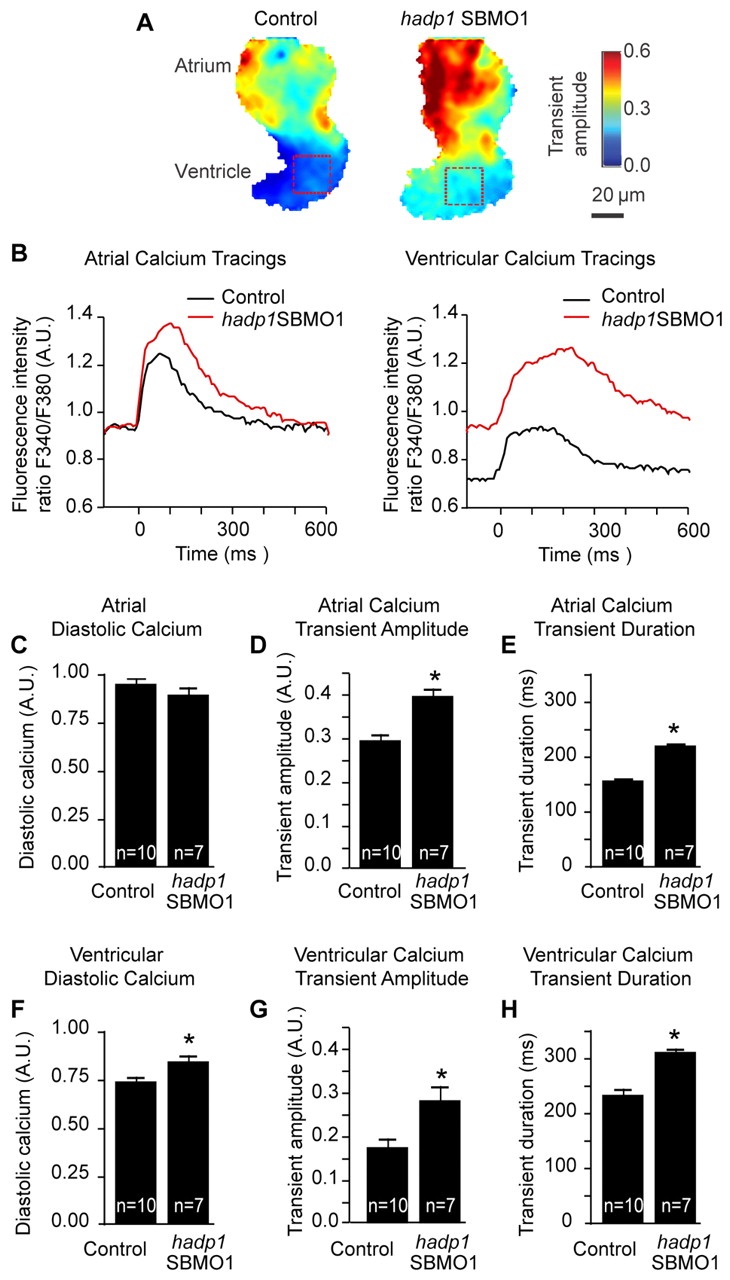
Fig. 7
Ca2+ transient duration is altered following loss of hadp1. (A-H) Optical mapping and quantification of Ca2+ transients in the embryonic zebrafish heart. (A) Representative images of the mean Ca2+ transient amplitude following optical mapping, using the ratiometric dye Fura-2, in control and hadp1 morphant hearts. The red box denotes an example of the pixel areas that were sampled for quantification of ventricular transients. The far-right scale indicates the transient amplitude intensity. (B) Representative traces of Ca2+ transients from single sites in the atrium and ventricle of control (black) and hadp1 morphants (red). (C-E) Quantification of the atrial diastolic Ca2+ (C), transient amplitude (D) and transient duration (E). (F-H) Quantification of the ventricular diastolic Ca2+ (F), transient amplitude (G) and transient duration (H).