Fig. S2
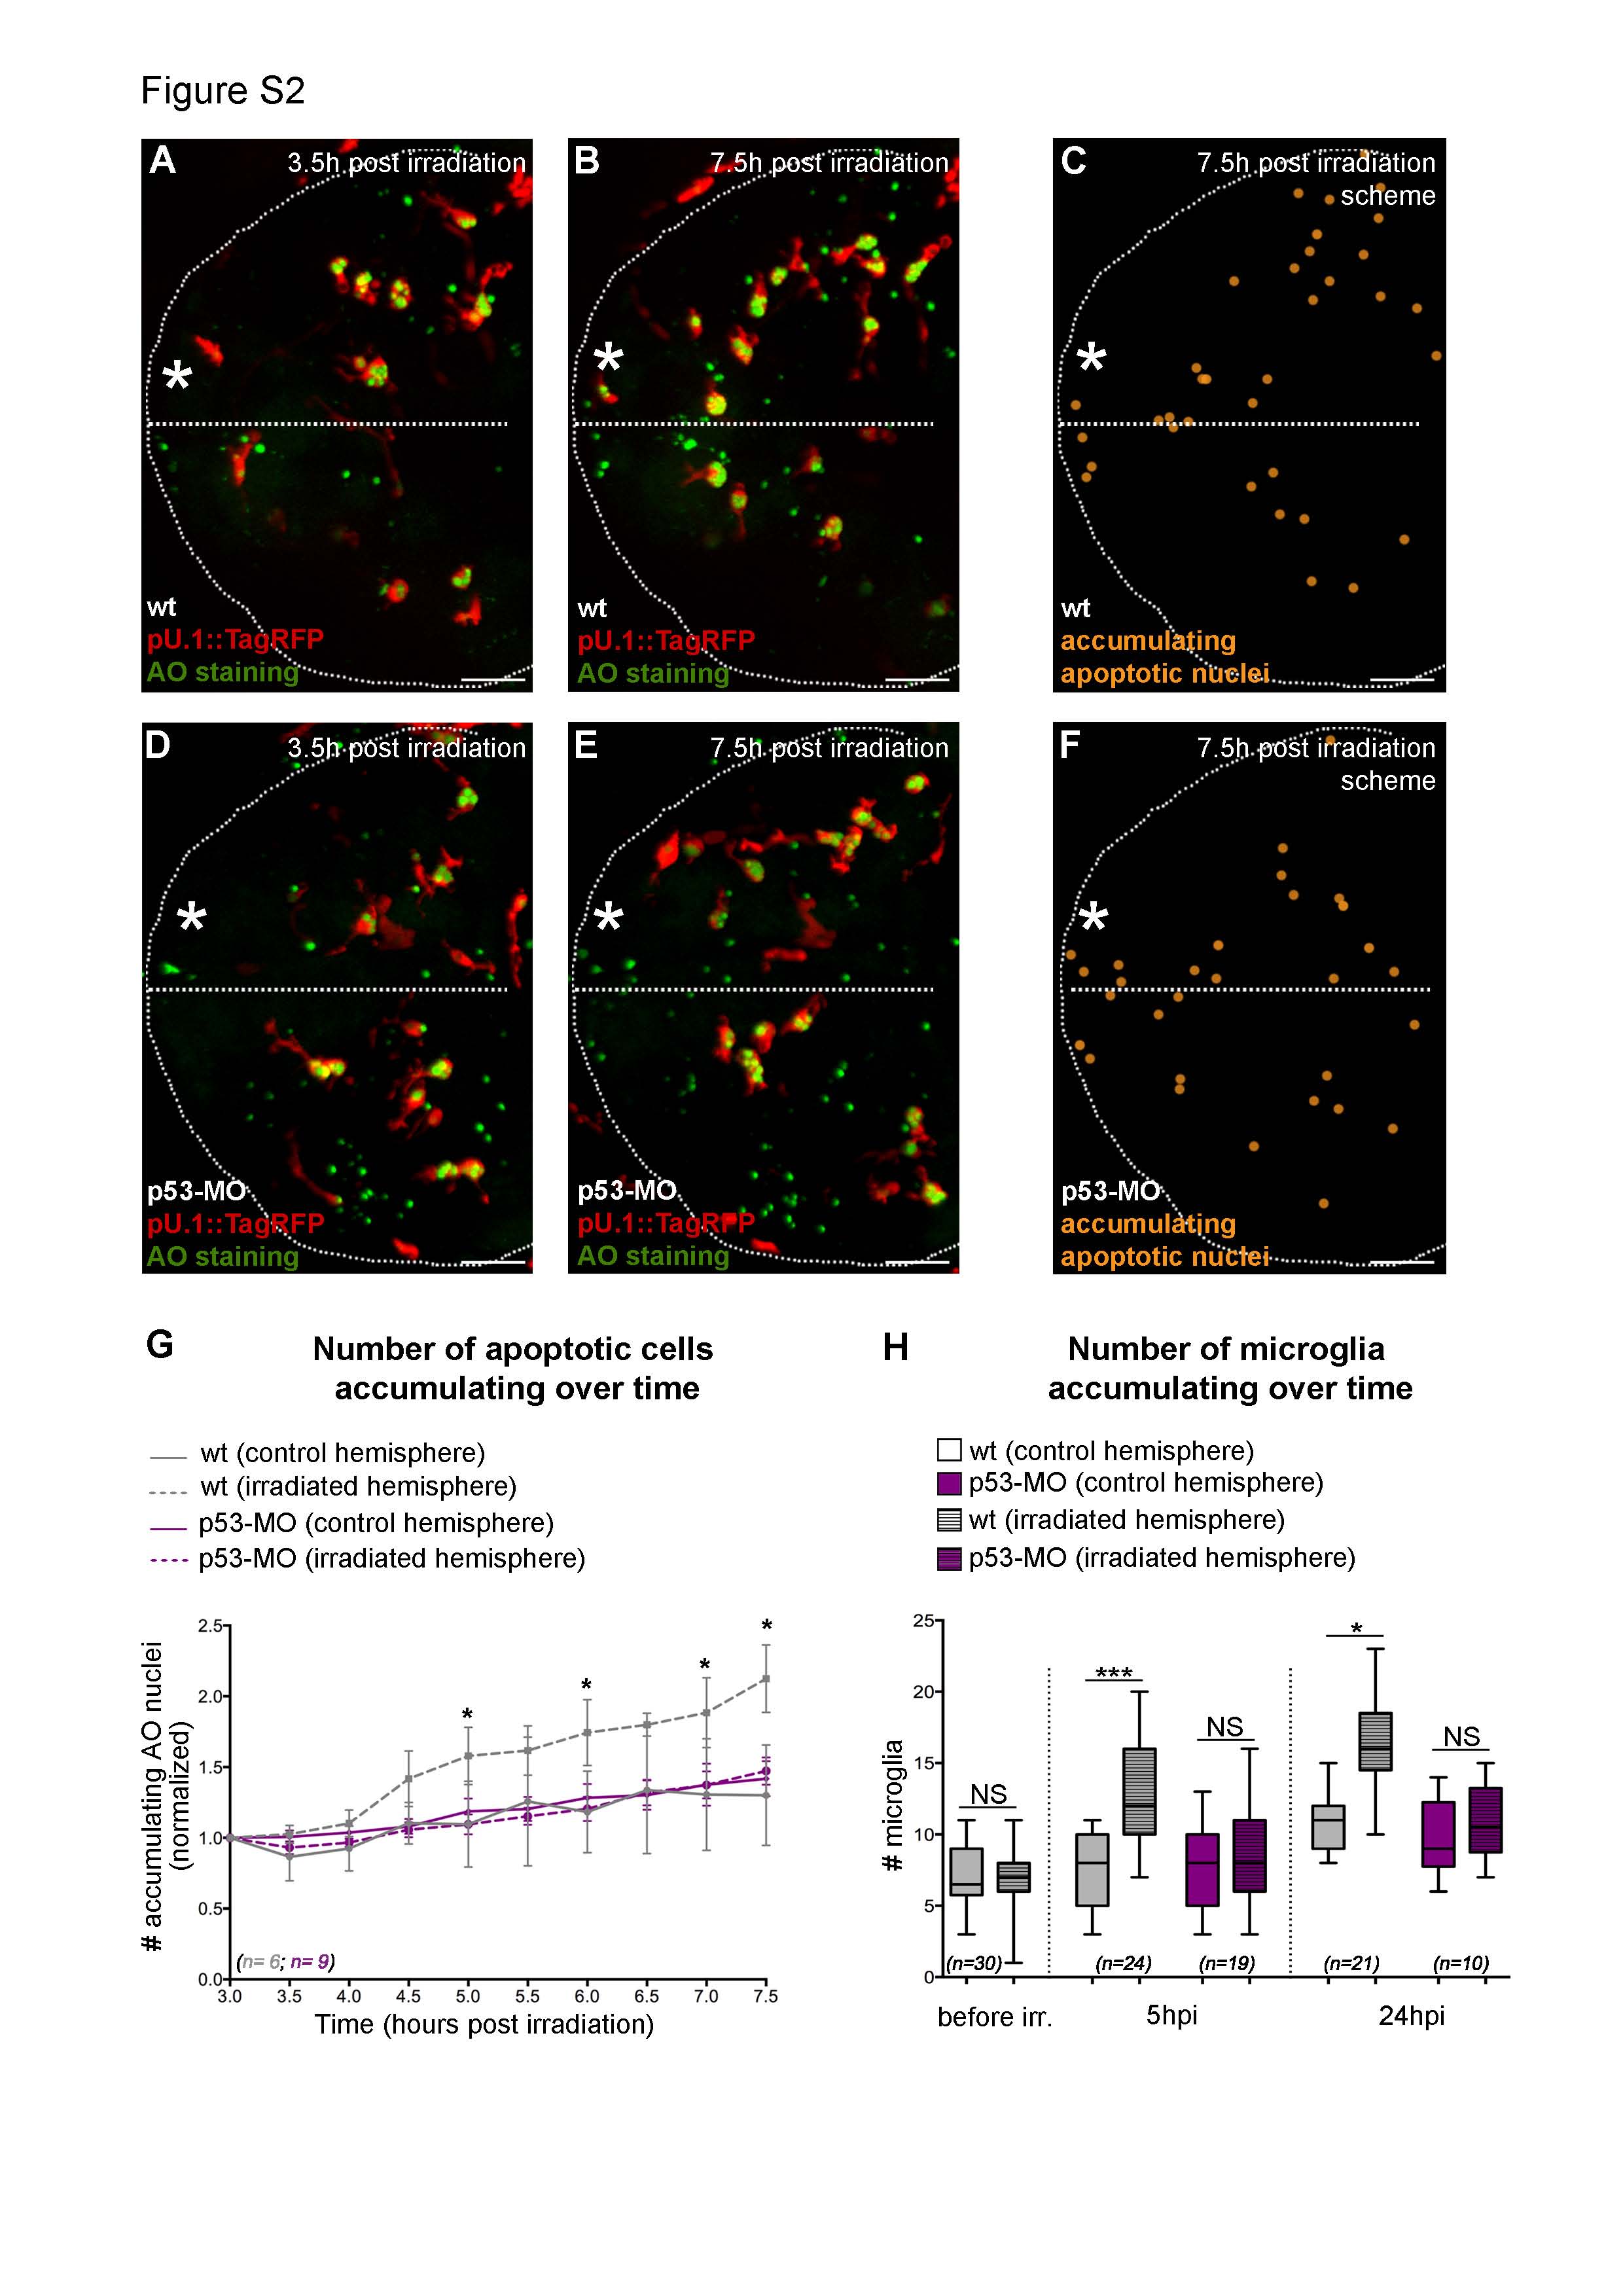
The number of microglia increases in response to UV-induced neuronal apoptosis. Related to Figure 2.
(A-B), (D-E) Representative time-lapse images showing microglia (red) and apoptotic cells stained with acridine orange (green) in the optic tectum of a wild type pU.1::GAL4-UAS::TagRFP embryo (A, B) and in a pU.1::GAL4-UAS::TagRFP embryo injected with p53-morpholino (D, E), 3.5h and 7.5h after UV irradiation.
(C and F) Schematic representation of (B) and (E), respectively. Orange dots mark the position of apoptotic nuclei 7.5h after UV irradiation. G, Quantification of apoptotic nuclei over time in control (solid line) or irradiated (dashed line) hemispheres in wild type (grey) and p53-morphants (purple). Asterisks refer to the statistical significance between control and irradiated hemispheres. Data from 3 independent experiments.
(H) Quantification of microglia in control (empty box) and irradiated (lined box) hemispheres in wild type (grey) and p53-morphant (purple) brains, before irradiation, 5h and 24h post-irradiation. Data from 3 independent experiments. Dotted lines delimit the tectal area and the separation between the two hemispheres. White asterisks indicate the irradiated hemisphere. AO, acridine orange. hpi, hours post irradiation. Scale bar, 30Ám. n, number of analyzed embryos. NS, non significant. * p < 0.05, *** p < 0.001.

