
|
Fig. 3
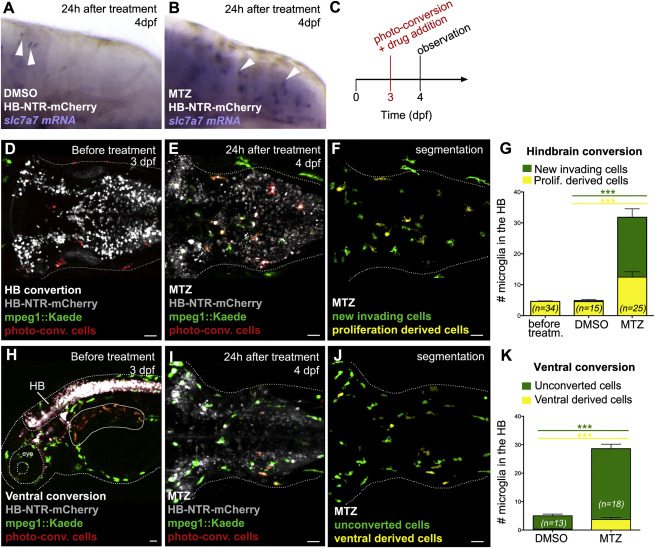
Neuronal Apoptosis Promotes Microglial Brain Colonization by Attracting Macrophages into the Brain
(A and B) Whole mount in situ hybridization (WISH) images show slc7a7 expression (white arrowheads) in HB-NTR-mCherry transgenic embryos 24 hr after DMSO (A) or MTZ (B) treatment.
(C) Experimental setup. At 3 dpf, Kaede+ cells are photo-converted in the hindbrain or ventral region of NTR-mCherry+ embryos and soon after samples are treated with DMSO or MTZ. Then 24 hr later green and red/yellow cells are quantified in the hindbrain.
(D and E) Hindbrain dorsal views of a 3-dpf mpeg1::GAL4-UAS::Kaede;HB-NTR-mCherry embryo, after microglia photo-conversion and prior to drug treatment (D) and 24 hr after photo-conversion and MTZ treatment (E). New invading microglia are in green and microglia derived from converted cells are in red/yellow.
(F and J) Segmented images of (E) and (I), respectively. NTR-mCherry+ neurons are omitted.
(G) Quantification of hindbrain microglia after induction of apoptosis. Histogram on the left refers to the number of photo-converted microglia populating the hindbrain prior to MTZ incubation; histograms on the right represent the number of newly arrived microglia (green bars) and those resulting from local proliferation (yellow bars) 24 hr after photo-conversion and DMSO or MTZ treatment. Data are from three independent experiments.
(H) Lateral view shows a 3-dpf mpeg1::GAL4-UAS::Kaede;HB-NTR-mCherry embryo, after photo-conversion of Kaede+ macrophages in the ventral region (red cells, solid line) and before MTZ treatment.
(I) Hindbrain dorsal view of an mpeg1::GAL4-UAS::Kaede;HB-NTR-mCherry embryo, 24 hr after ventral photo-conversion and MTZ treatment. Invading cells deriving from the ventral region are in red/yellow.
(K) Number of hindbrain microglia in mpeg1::GAL4-UAS::Kaede;HB-NTR-mCherry embryos, 24 hr after ventral photo-conversion and drug treatment. Data are from three independent experiments.
HB, hindbrain; n, number of embryos; NS, non-significant; ***p < 0.001. NTR-mCherry+ neurons are in gray. Dotted line marks the hindbrain area or the embryo outline. Scale bar represents 30 �m.