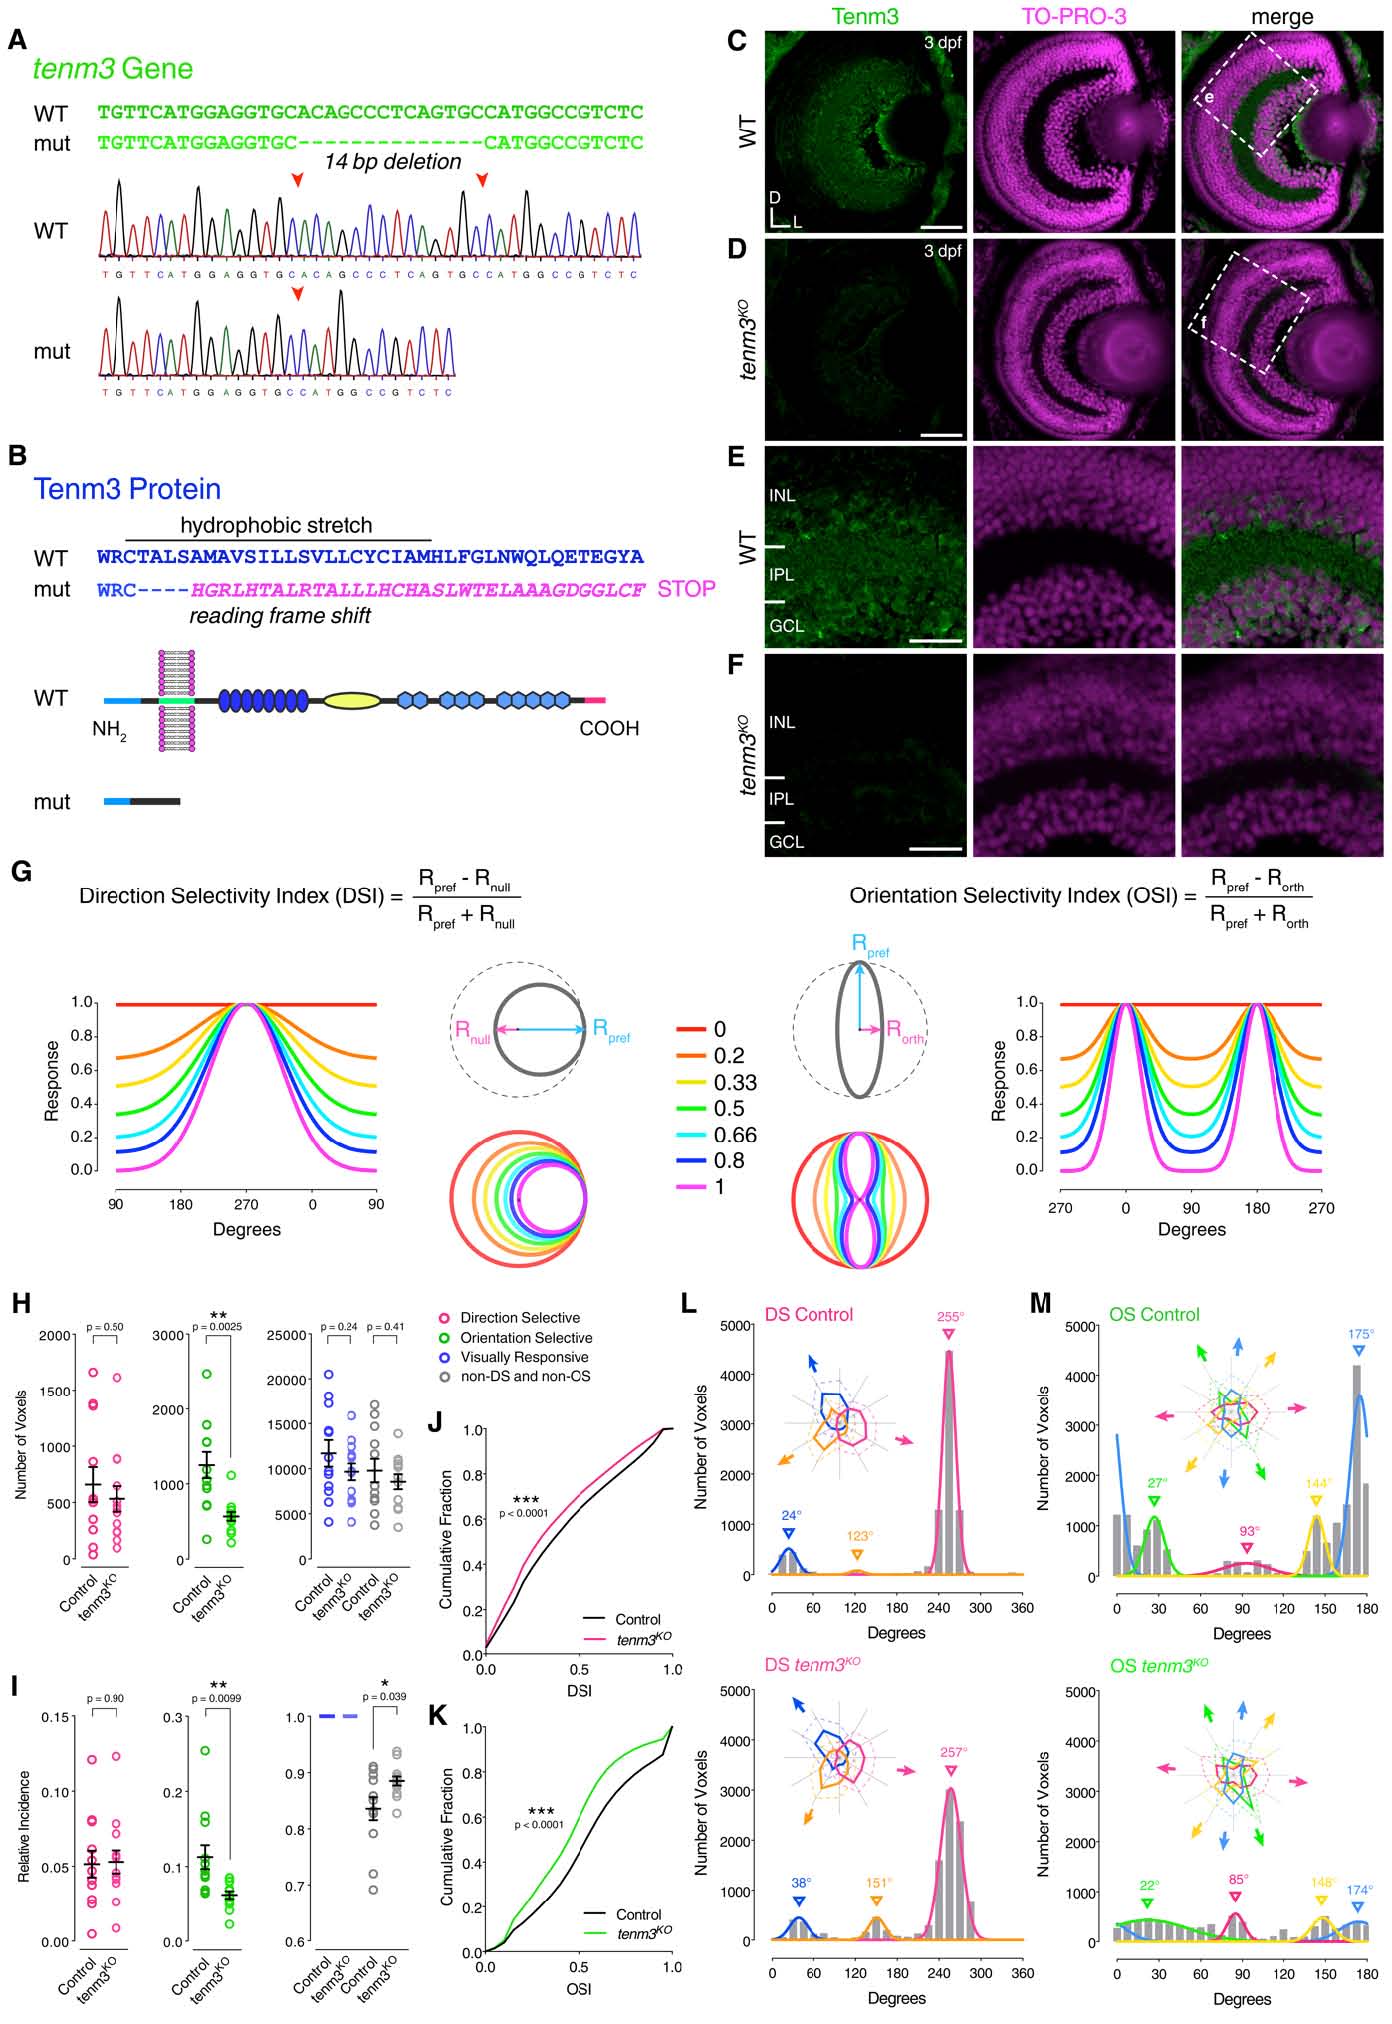
Fig. S1
Tenm3 Knock-out, Quantification of Direction and Orientation Selectivity, and Tenm3 Functional Role in Late Development, Related to Figure 1 and Movie S1. (A and B) TALEN-mediated tenm3 gene knock-out (A) and consequent structural changes in the Tenm3 protein (B). DNA sequencing chromatograms show the 14-base pair (bp) deletion present in tenm3KO mutant (mut) larvae. This deletion in the gene region encoding the transmembrane domain of Tenm3 generates a reading frame shift and subsequent premature stop codon, therefore leading to the production of a non-functional Tenm3 protein missing its entire extracellular domain. (C and D) Immunostaining showing the expression of Tenm3 (green) in retinae of 3-dpf WT (C) and tenm3KO larvae (D). Cell bodies are labelled with the nuclear stain TO-PRO-3 (magenta). D, dorsal; L, lateral. Scale bars are 40 Ám. (E and F) Insets in (C) and (D) showing that, in the WT retina (E), Tenm3 is expressed in the inner nuclear layer (INL) and ganglion cell layer (GCL), whereas no Tenm3 expression is present in the tenm3KO retina (F). IPL, inner plexiform layer. Scale bars are 20 Ám. Importantly, all images in (CF) were obtained using the same acquisition settings. (G) Diagram illustrating the quantification of direction selectivity (left) and orientation selectivity (right) using the direction selectivity index (DSI) and orientation selectivity index (OSI), respectively. The algorithms used to calculate DSI and OSI of visual responses are reported at the top. For DSI, the responses to the preferred direction of moving bars (Rpref) and opposite, or null, direction (Rnull; 180░ angular distance) are used. For OSI, the responses to the preferred axis (Rpref) and orthogonal axis (Rorth; 90░ angular distance) are used. Note that the arrows indicate the motion direction of orthogonally oriented bars or gratings. A single Gaussian or von-Mises distribution is used to fit responses of direction-selective cells and estimate their preferred direction of motion from the centre of the fitted curve. The sum of two Gaussian or von-Mises distributions (180░ angular distance apart) is used to fit responses of orientation-selective cells in order to estimate their preferred axis and stimulus orientation from the centres of the fitted curves. The colour code describes the different levels of direction (left) and orientation (right) selectivity. (H and I) Average number (H) and relative frequency (I) of DS, OS, visually responsive and non- DS/non-OS voxels per Z-plane in control (n = 12 larvae) and tenm3KO (n = 13 larvae) 7-dpf Tg(isl2b:Gal4;UAS:SyGCaMP3) larvae. Error bars are ▒ SEM. *p < 0.05, **p < 0.01, unpaired twotailed Student?s t test. (J and K) Cumulative distributions of DSI values (R2 > 0) across voxels with OSI < 0.5 (J) and OSI values (R2 > 0) across voxels with DSI < 0.5 (K) in control and tenm3KO larvae. ***p < 0.001, twosample Kolmogorov-Smirnov test. (L and M) Cumulative histograms summarising the incidence of preferred angles for identified DS (L) and OS voxels (M) in control (n = 12; top) and tenm3KO (n = 13; bottom) 7-dpf larvae. Overlaid curves are the fitted Gaussian distributions for each DS or OS subtype. Polar plots illustrate the mean (+ 1 SD) normalised response profiles for each DS or OS subtype.

