Fig. 5
Morphological Diversity of Individual Tenm3+ AC Types
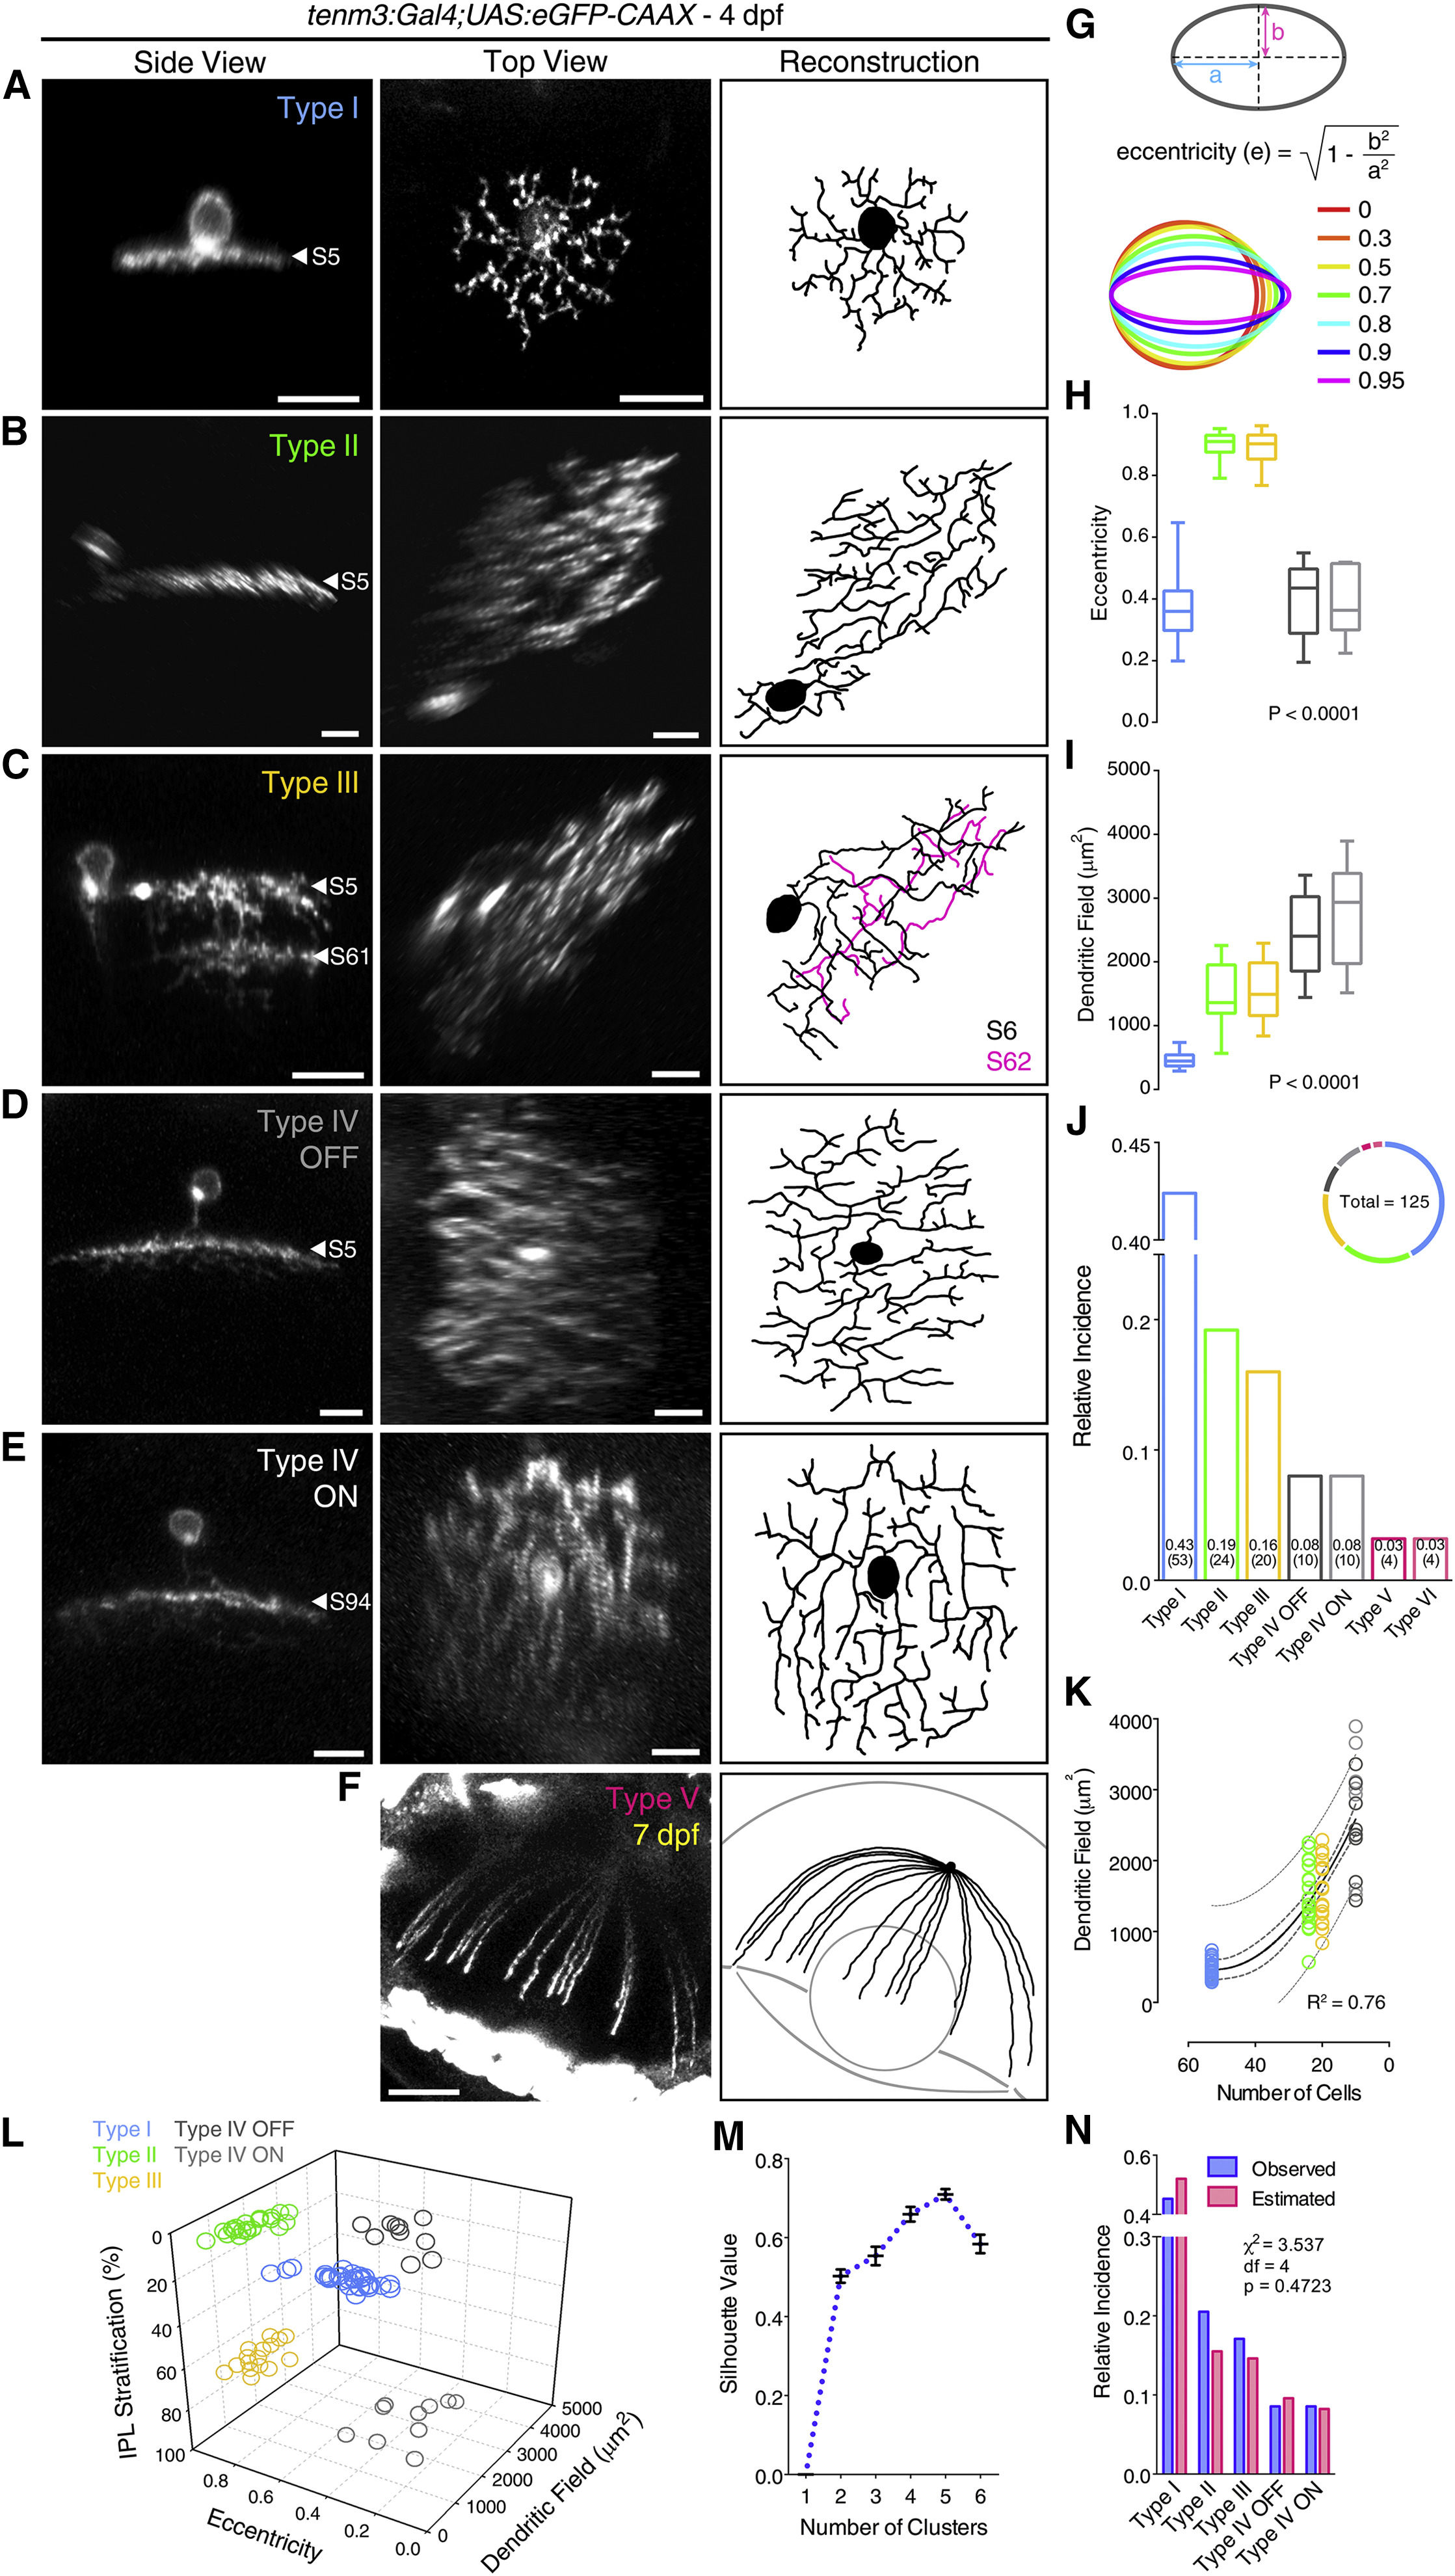
(A-F) Morphologies of single tenm3+ ACs expressing eGFP-CAAX in 4-dpf UAS:eGFP-CAAX-injected Tg(tenm3:Gal4) larvae. The side views (left), top views (middle), and top view 3D reconstructions (right) are shown. IPL strata location of tenm3+ AC neurites is indicated by the letter ?S? followed by the relative IPL position. The 3D reconstructed neurites of the bi-stratified type III tenm3+ AC are color-coded according to the stratum they are located. Note that the type V tenm3+ AC shown in (F) is from a 7-dpf larva. Scale bars, 10 Ám in (A)-(E) and 40 Ám in (F).
(G) Diagram illustrating the quantification of dendritic field elongation by calculating the eccentricity of dendritic arbor profiles following ellipse fitting. ?a? is the length of the semi-major axis, and ?b? is the length of the semi-minor axis.
(H-J) Dendritic field elongation (i.e., eccentricity; H), dendritic field area (I), and relative frequency (J) of identified tenm3+ AC types (n = 125 cells from 65 larvae). The number of observed cells for each tenm3+ AC type is reported in brackets (J). Boxplots indicate interquartile ranges (boxes), medians (lines in boxes), and ranges (min-max, whiskers). p values are the results of one-way ANOVA.
(K) Relationship between dendritic field area of type I-IV tenm3+ ACs and their observed frequency (in number of cells). The continuous curve shows the nonlinear regression of the data with a second order polynomial function indicating a quadratic relationship between the two variables. Thick and thin dashed curves report the 95% confidence and prediction bands of the nonlinear fit, respectively. Goodness of fit value (R2) is reported at the bottom-right corner.
(L and M) k-means clustering of type I-IV tenm3+ ACs based on their IPL stratification, dendritic field area, and dendritic field elongation. Individual cell data points are color coded according to which tenm3+ AC type they have been classified (L). Analysis of mean silhouette values for increasing number of clusters indicates that five clusters best describe the dataset (M). Importantly, the five cell clusters obtained by k-means are consistent with the classification of the most frequent tenm3+ ACs into five different types. Error bars, ▒SEM.
(N) Observed (blue) and estimated (red; assuming a retinal coverage factor of 1) relative frequencies of type I-IV tenm3+ ACs. Results of the two-tailed chi-square test are reported.
See also Table S1.

