Fig. 1
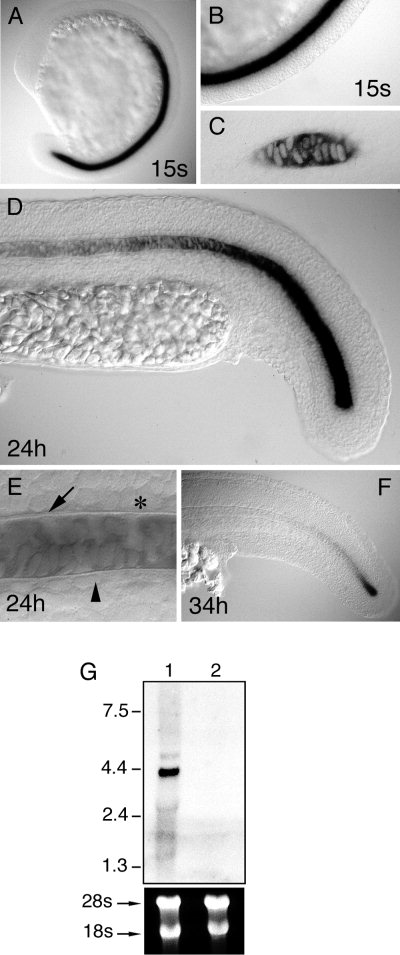
Expression of Calymmin mRNA during zebrafish embryogenesis as detected by whole-mount in situ hybridization (A-F) and Northern blot (G). Lateral views of embryos with rostral to the left (A,B,D-F) and 2- to 3-µm cross-section (C). A-C: Expression of the mRNA in notochord precursor cells in 15-somite stage embryos; C shows that transcripts are specifically expressed by the vacuolated notochord cells. D,E: Pharyngula period (24 hours postfertilization [hpf]). In D, the expression of c29-77 cDNA in the notochord shows a gradient with a higher level of transcripts toward the cells located in the tail region. E shows specific expression in the notochord cells at the level of the trunk, whereas both the adjacent floor plate (asterisk) and hypochord (arrowhead) cell layers are negative; the notochord sheath is indicated by an arrow. F: 34 hpf-embryos showing that expression becomes restricted to notochord cells located in the posterior region of the tail (F), where the notochord cells are differentiating. The results shown were obtained by using DIG-labelled riboprobes derived from full-length c29-77 (3.273 kb) and are identical when using riboprobes synthesized from c39a (4.049 kb). G: Northern blot showing the detection of a ~4.1-kb mRNA in 14- to 19-somite-stage zebrafish embryos (lane 1), whereas the message was not detected in adult fish (lane 2). Thirty micrograms of total RNA were loaded per lane. The size of molecular markers and ribosomal RNA is indicated on the left.

