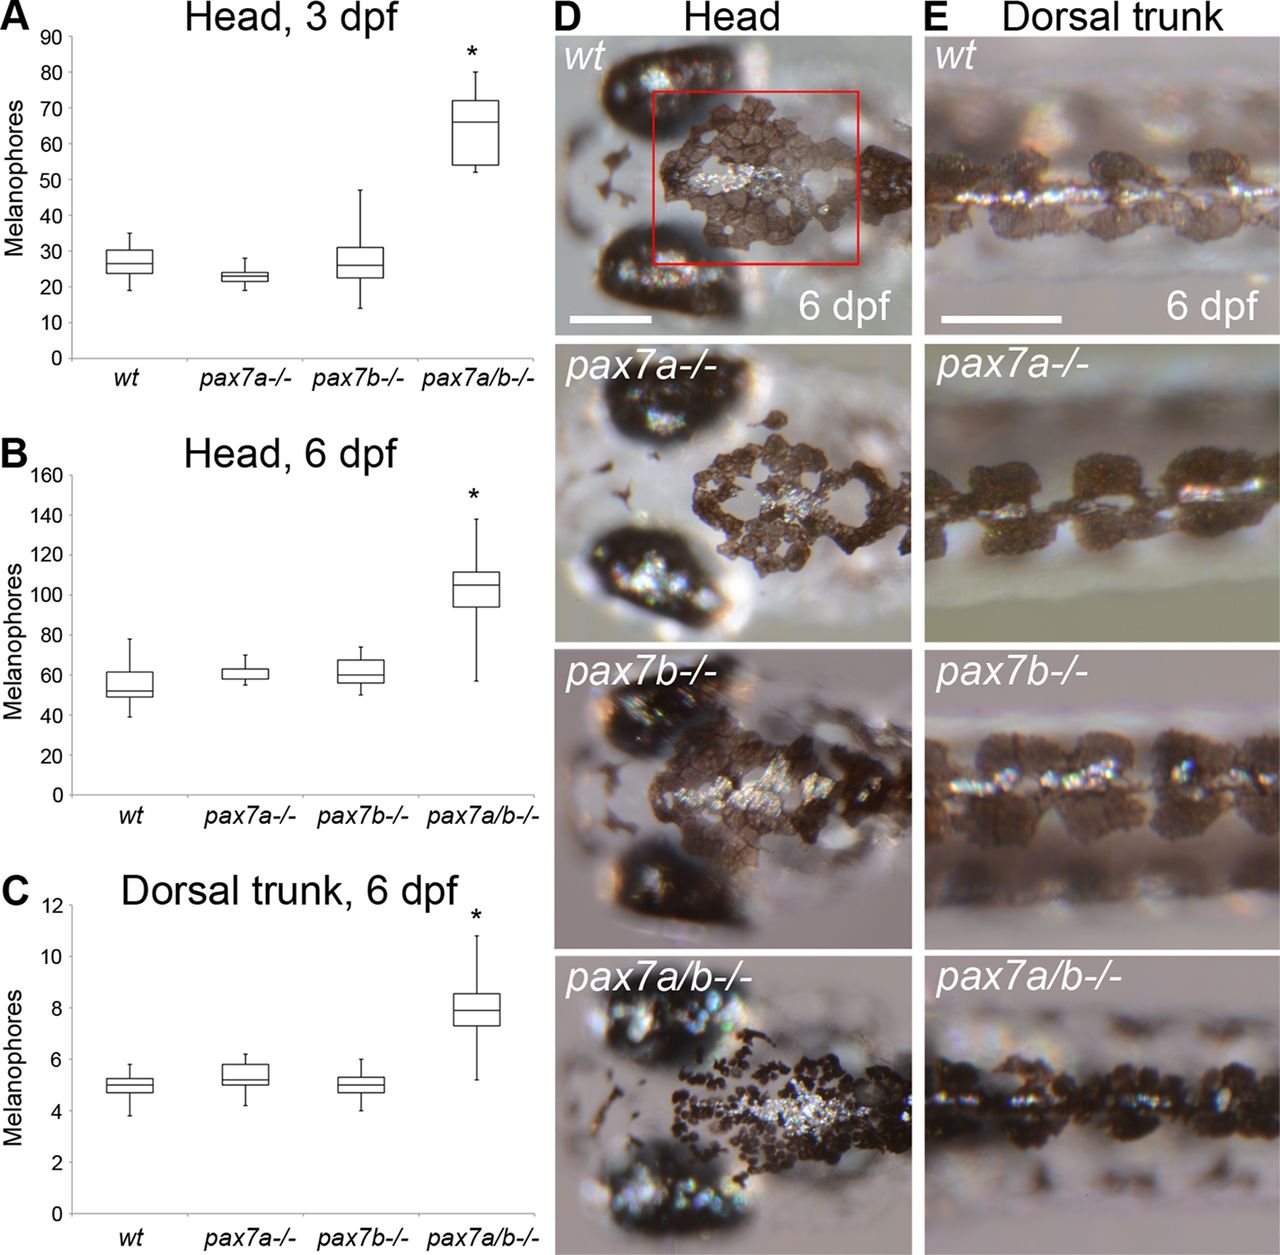
Fig. 2 The pax7a/pax7b double-mutant embryo and larvae display an increased number of melanophores. (A) Number of melanophores on the crown of the head between the midbrain?hindbrain border and the most anterior part of the dorsal larval melanophore stripe in wt (n = 16), pax7a-/- (n = 11), pax7b-/- (n = 15), and pax7a/pax7b double-mutant (n = 11) zebrafish embryos at 3 dpf. The pax7a/pax7b double mutants differ from all other groups with p < 0.001. (B) Number of melanophores on the crown of the head between the midbrain?hindbrain border and the most anterior part of the dorsal larval melanophore stripe in wt (n = 11), pax7a-/- (n = 5), pax7b-/- (n = 7), and pax7a/pax7b double-mutant (n = 11) zebrafish larvae at 6 dpf. The pax7a/pax7b double mutants differ from all other groups with p < 0.001. The red box in D indicates area of counting. (C) Number of melanophores/somite in the dorsal larval melanophore stripe of wt (n = 12), pax7a-/- (n = 5), pax7b-/- (n = 11), and pax7a/pax7b double-mutant (n = 10) zebrafish larvae at 6 dpf. Somites 8?12 were counted. The pax7a/pax7b double mutants differ from all other groups with p < 0.001. (D) Head melanophore phenotype in wt, pax7a-/-, pax7b-/-, and pax7a/pax7b double-mutant zebrafish larvae at 6 dpf. (E) Dorsal larval melanophore stripe phenotype in wt, pax7a-/-, pax7b-/-, and pax7a/pax7b double-mutant zebrafish larvae at 6 dpf. Comparisons between groups by one-way ANOVA or Kruskal?Wallis ANOVA on ranks with Student?s?Newman?Keuls or Dunn?s post hoc contrast test for parametric and nonparametric data. Scale bar, 200 μm.
Image
Figure Caption
Figure Data
Acknowledgments
This image is the copyrighted work of the attributed author or publisher, and
ZFIN has permission only to display this image to its users.
Additional permissions should be obtained from the applicable author or publisher of the image.
Full text @ Mol. Biol. Cell

