
|
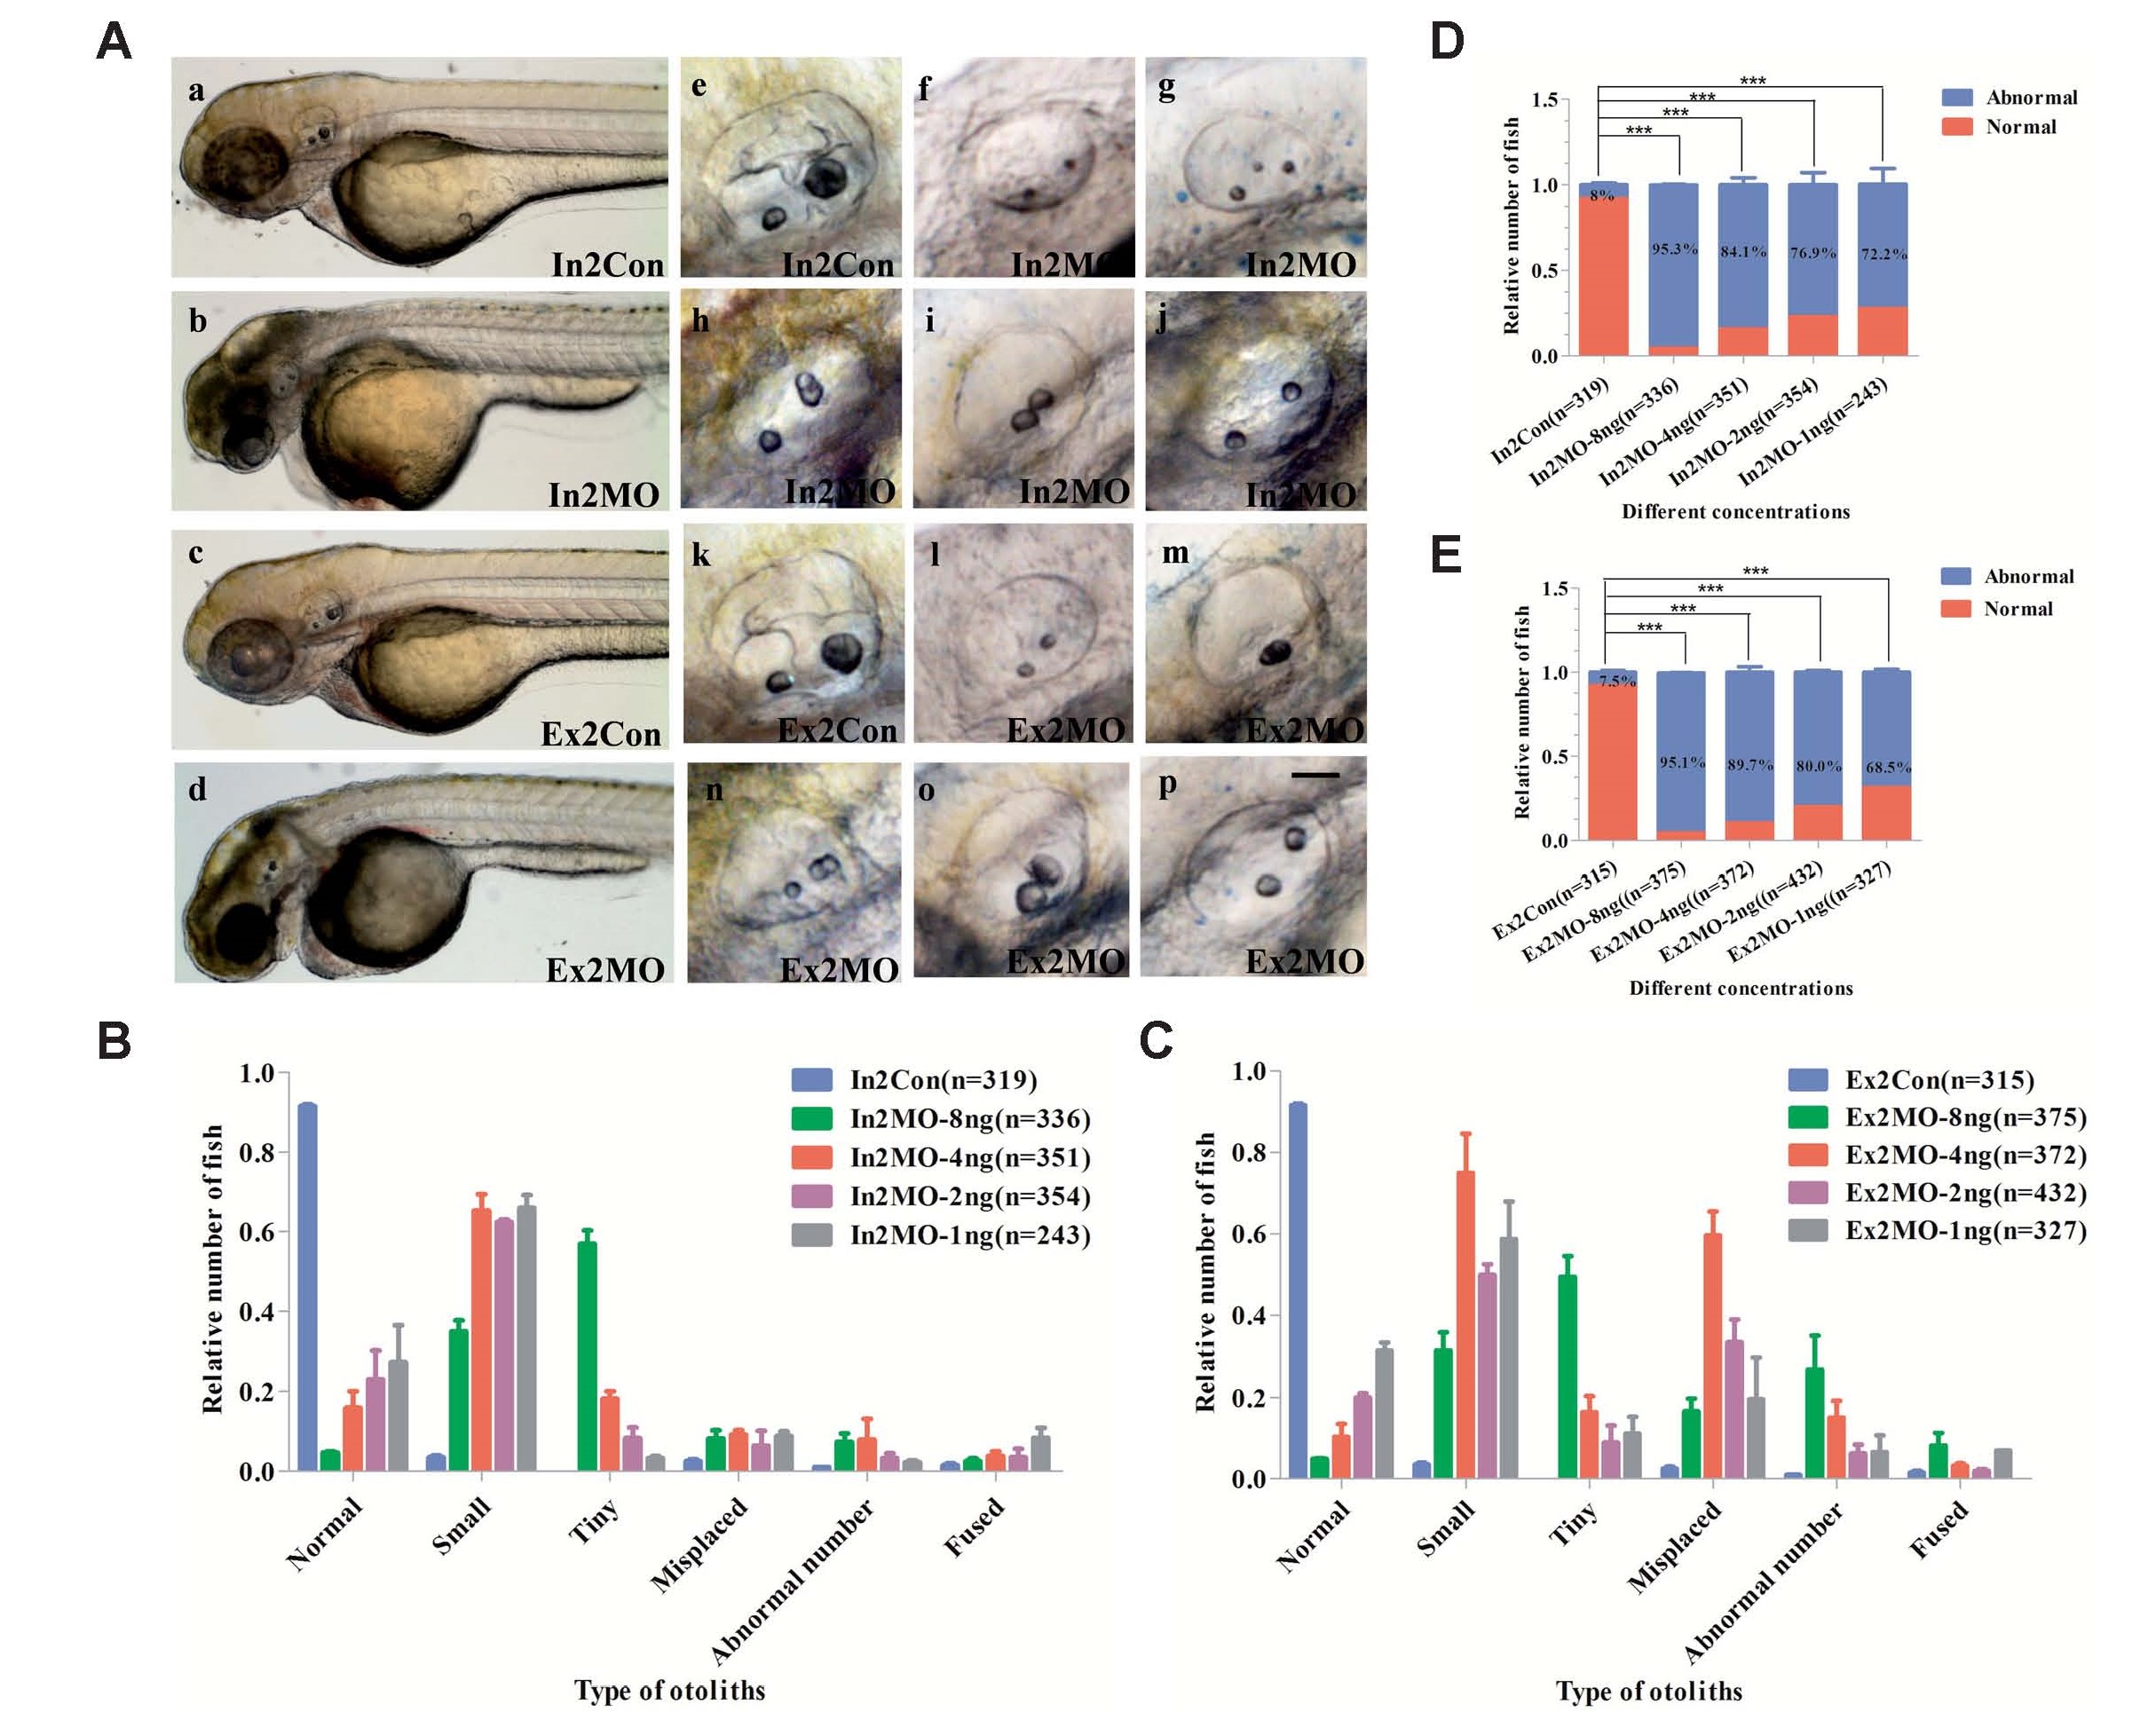
Fig. 2
Otic developmental defects in Msrb3 morphants. (A) Overall morphology of mismatched controls (In2Con, a; Ex2Con, c) and msrb3 morphants (In2MO, b; Ex2MO, d) at 60 hpf indicated otolith abnormalities. Otic vesicles were visualized at 60 hpf using DIC microscopy. Scale bars: 50 �m. Unlike mismatch control (e; k), msrb3 morphants had tiny otoliths (f, l), abnormal otolith numbers (g, m), fused otoliths (h, n), misplaced otoliths (i, o), small otoliths (j, p), shrunken inner ears, and malformed semicircular canals (f-g, l-p). (B,C) Quantitative analysis of otolith defects of In2MO and Ex2MO at different concentrations at 60 hpf. Relative number of fish with otic developmental defects. (D,E) Statistical analysis of otolith abnormalities in controls and msrb3 morphants. Error bars are s.d. ***P<0.0001.