
|
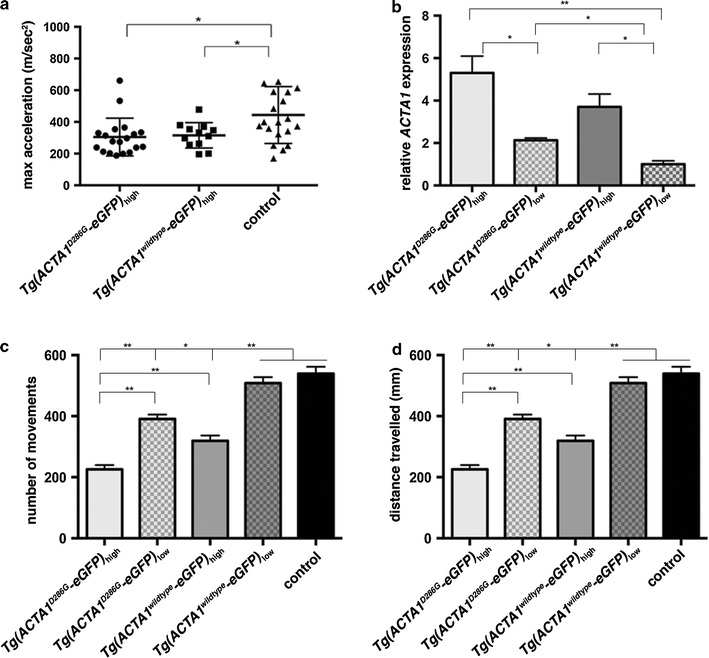
Fig. 4
Quantification of muscle function in Tg(ACTA1-eGFP) zebrafish. a Quantification of the maximum acceleration recorded from touch-evoked response assays of Tg(ACTA1D286G-eGFP)high and Tg(ACTA1wildtype-eGFP)high zebrafish compared to control zebrafish at 2 dpf. Error bars represent SD for n = 15?19 zebrafish, *p < 0.05. b qRT-PCR analysis of ACTA1-eGFP expression in transgenic lines at 2 dpf. No significant difference was observed between Tg(ACTA1D286G-eGFP)high and Tg(ACTA1wildtype-eGFP)high zebrafish. Error bars represent �SEM for four replicate experiments with each experiment comprising a pooled samples of 20 fish, *p < 0.05, **p < 0.01. c, d Quantification of the c number of small movements and d distance traveled by Tg(ACTA1D286G-eGFP)high and Tg(ACTA1wildtype-eGFP)high and Tg(ACTA1D286G-eGFP)low and Tg(ACTA1wildtype-eGFP)low strains compared to control fish at 6 dpf. Error bars represent �SEM for three replicate experiments (n = 48 per experiment), *p < 0.05, **p < 0.01