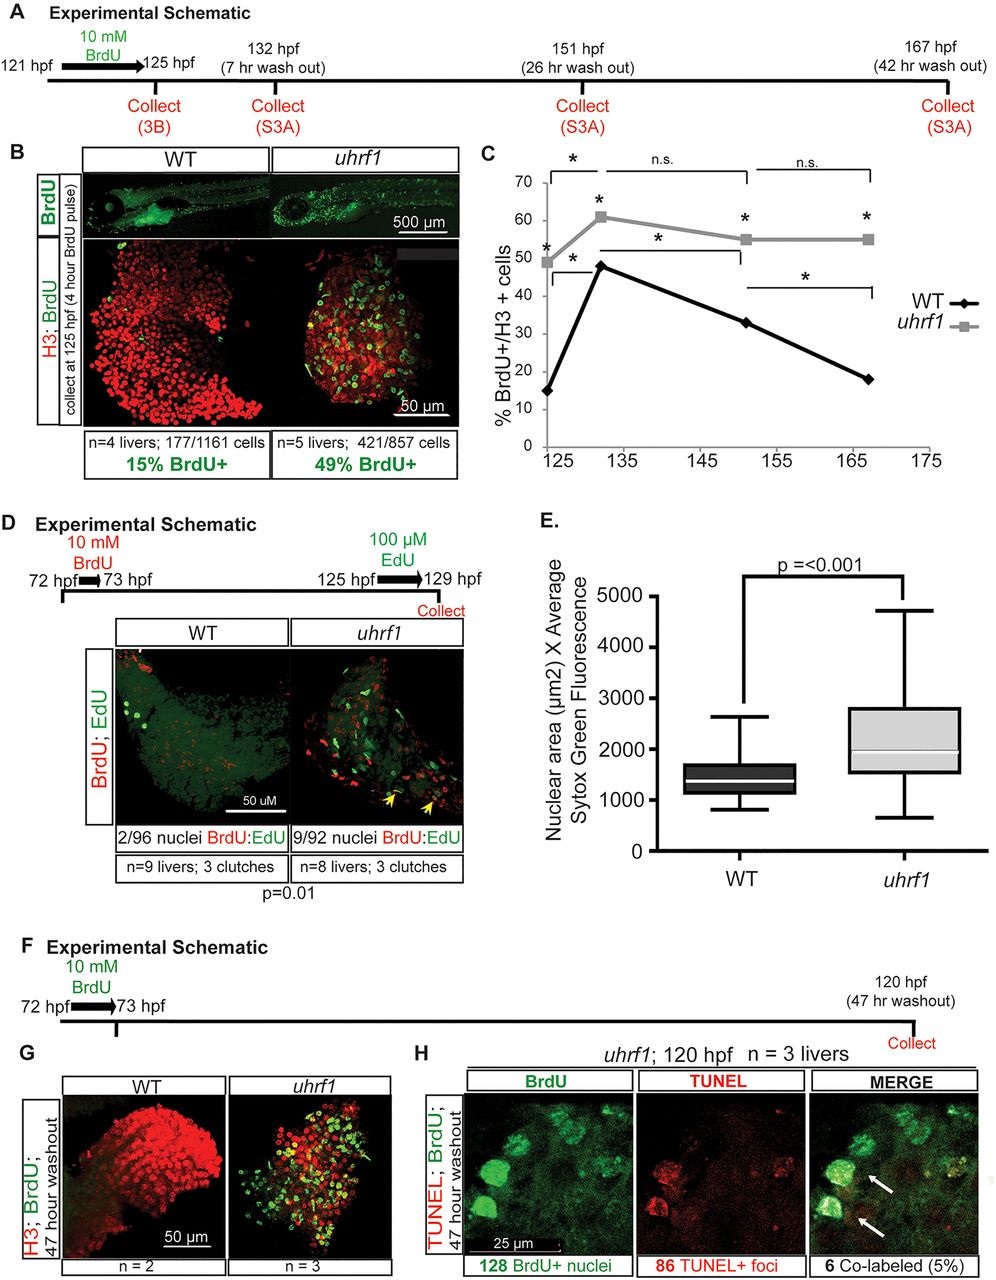
Fig. 3
uhrf1 mutant hepatocytes apoptose after failing to proceed through S phase. (A) BrdU pulse-chase experiment overview. The figures and figure panels containing the data from each collection point are indicated. (B) Immunofluorescence for BrdU and H3 to label all nuclei on livers from uhrf1 and wild-type larvae collected at 124hpf, immediately after BrdU pulse. BrdU- and H3-positive cells were counted for four or five livers per genotype. (C) Average number of BrdU-positive nuclei in three to five livers per sample relative to nuclear H3 (see panel B and supplementary material Fig. S3D for raw numbers). Asterisks on the gray line indicate P<0.05 when comparing mutant and wild-type values; asterisks or n.s. (not significant) above the bars indicate differences between samples of the same genotype at different times. (D) Schematic of BrdU pulse at 72hpf chased with EdU at 125hpf. Livers were processed for both nucleotide analogs to determine percent of co-labeled nuclei. (E) Relative DNA content in uhrf1 compared with wild-type hepatocytes at 125hpf, as measured by Sytox Green staining. Top and bottom of box plot designate 75% and 25% of the population, respectively, separated by the median; bars represent 10th and 90th percentiles. (F) BrdU pulse-chase experiment outline. (G) Embryos treated for 1h with 10mM BrdU at 72hpf were collected at 120hpf (47h post-washout) and stained for H3 and BrdU. (H) Hepatocyte nuclei with both BrdU and TUNEL staining are labeled with white arrows.

