Fig. 5
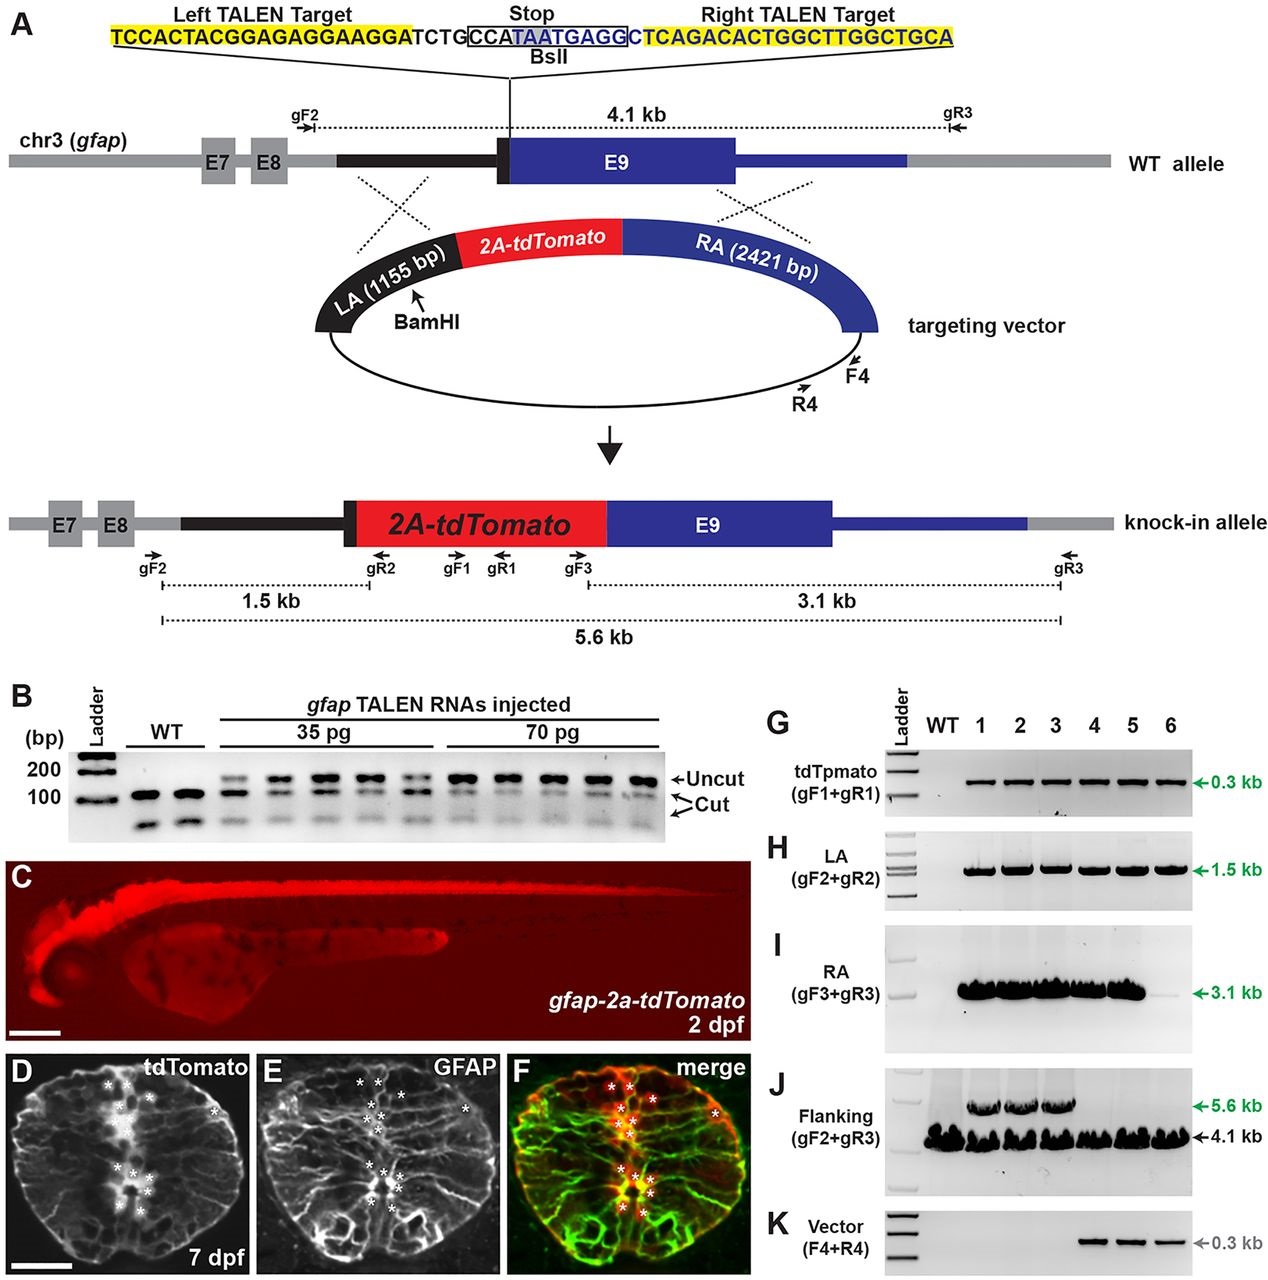
Analysis of gfap-2a-tdTomato knock-in lines. (A) The strategy for generating gfap-2a-tdTomato knock-in fish. gfap TALEN target sequences and stop codon are highlighted in yellow and gray, respectively. In the targeting construct, LA and RA are marked with black and blue, respectively. Red indicates tdTomato sequences linked to viral 2a peptide sequence. The targeting construct linearized with BamHI to generate an internal cut in LA. (B) Activity test of gfap TALEN RNAs. Each lane represents a BslI-digested amplicon encompassing gfap TALEN target sequence from genomic DNA isolated from individual embryo. The BslI-digested wild-type amplicon products are 112 and 50bp. WT, uninjected control; 35pg and 70pg, injection of 35 or 70pg of gfap TALEN RNA, respectively. (C) Lateral view of 2dpf gfap-2a-tdTomatostl85 knock-in F1 embryo. Scale bar: 200Ám. (D-F) Transverse spinal cord section of 7dpf gfap-2a-tdTomatostl85 larva. (D) tdTomato expression. (E) Anti-GFAP antibody staining. (F) Merged image of D and E. Asterisks indicate tdTomato-positive cell bodies. Scale bar: 20Ám. (G-K) PCR genotyping analysis. Primer pair locations are shown in A. WT, wild type; 1-6, gfap-2a-tdTomato F1 lines from different founders except lines 3 and 4 (see Table 2). (G) Detection of tdTomato (gF1+gR1 primers). (H) Amplicon extended from 5′ of the LA to within the tdTomato sequences (gF2+gR2). (I) Amplicon spanned the entire RA sequences (gF3+gR3). (J) Amplicon extended from 5′ of the LA to 3′ of the RA sequences (gF2+gR3). Expected amplicon size: wild type, 4.1kb; targeted, 5.6kb. (K) Amplicon for vector-specific sequences (F4+R4).

