Fig. 2
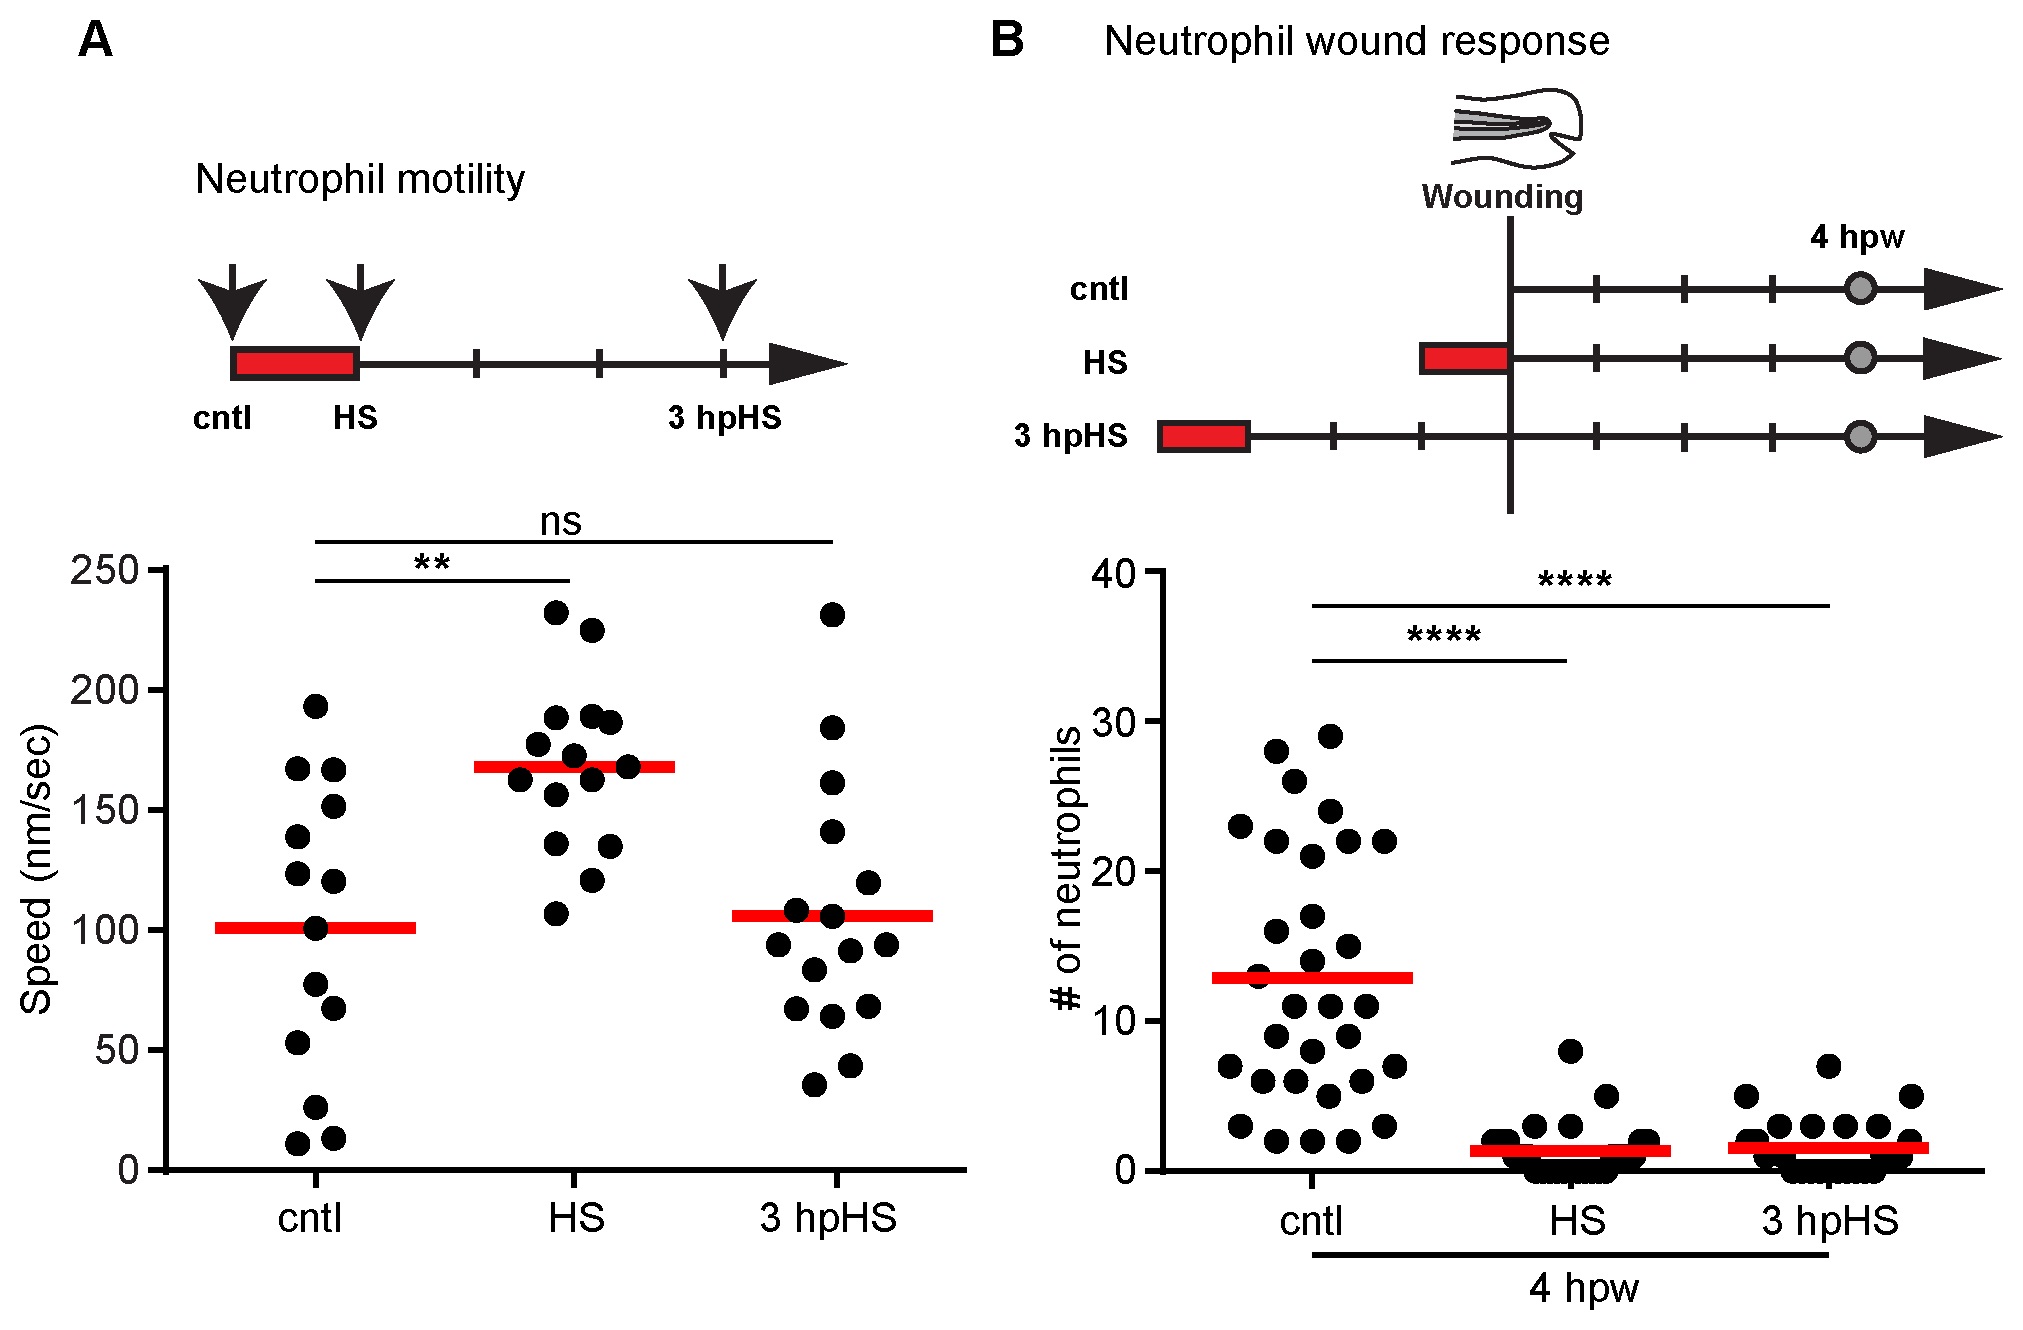
Heat shock induces transient changes in neutrophil random motility and sustained effects on recruitment to wounds.
(A) (Top) Schematic illustration of the experimental setup for quantification of neutrophil speed. The red rectangles indicate heat shock at 38-39°C for 1 hour. Arrows indicate the time point for neutrophil live imaging in the same larva before heat shock (cntl), right after heat shock (HS) and at 3 hours post heat shock (3 hpHS). (Bottom) Scatter plot showing the mean speed of Tg(mpx:dendra2) neutrophils at time points indicated. Neutrophils were tracked in 3 dimensions (3D) using Image J software and the MTrackJ plugin. HS larvae showed increased neutrophil speed compared with controls. At 3 hpHS, the speed of neutrophils went back to control levels. **P<0.01; ns, not significant (one way ANOVA with Dunn?s multiple comparison test). (B) (Top) Schematic illustration of the experimental setup for tail fin wounding. Larvae were wounded without heat shock (cntl), right after heat shock (HS) or at 3 hours post heat shock (3 hpHS). Larvae were then fixed at 4 hours post wounding (hpw) for quantification of neutrophils (grey circles). (Bottom) Quantification of neutrophils at tail fin wounds at 4 hpw. The effect of HS on neutrophil wound response persisted even when the wound was induced at 3 hpHS. ****P<0.0001 (one way ANOVA with Dunn?s multiple comparison test). Data are representative of at least three experiments.

