Fig. 5
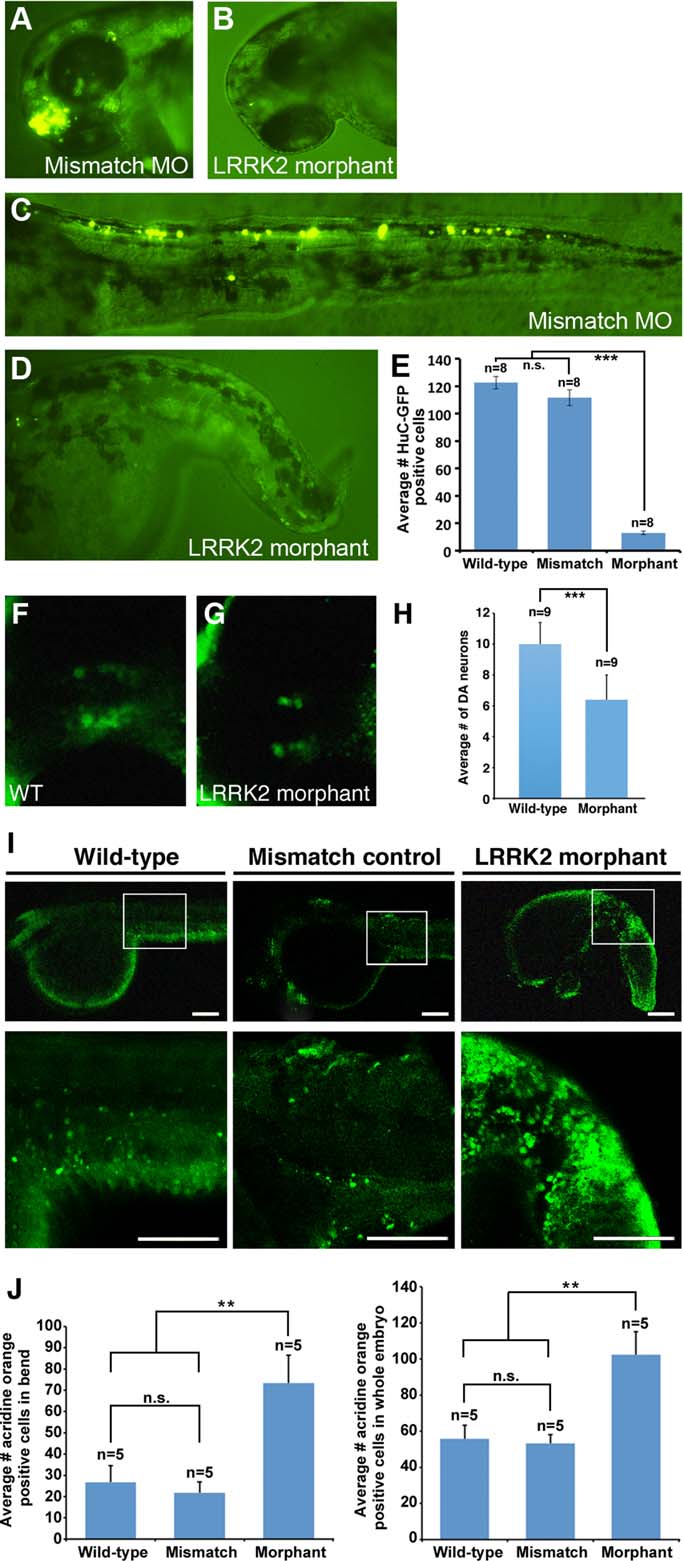
LRRK2 knockdown decreases the number of neurons, including DA neurons. A: Head of an embryo coinjected with HuC-GFP and mismatch control MO. B: Head of a LRRK2 morphant embryo coinjected with HuC-GFP and LRRK2 translational MO. C: Tail of an embryo coinjected with HuC-GFP and mismatch control MO. D: Tail of a LRRK2 morphant embryo coinjected with HuC-GFP and LRRK2 translational MO. LRRK2 knockdown causes a reduction in neurons compared with the mismatch control MO-injected embryos. E: Quantification of Huc-GFP-positive cells in embryos showing a significant reduction in the average number of Huc-GFP-positive cells in the LRRK2 translational MO-injected embryos compared with the wt and mismatch control MO-injected embryos. n = 8 for each group, images of eight embryos from eight different individual injection experiments were analyzed for each group, ***P < 0.001. F: Head of a representative wt embryo at 72 hpf immunostained with an anti-TH antibody showing the normal complement of DA neurons (green fluorescence). G: Head of a representative LRRK2 morphant embryo at 72 hpf immunostained with an anti-TH antibody showing a significant reduction of DA neurons compared with wt embryos (green fluorescence). H: Quantification of TH-positive cells in wt and LRRK2 morphant embryos. n = 9 for each group, ***P < 0.001. I: Acridine orange staining of wt, LRRK2 5-nt mismatch control and LRRK2 morphant embryos at 48 hpf showing extensive cell death in the tail region surrounding the bend of the LRRK2 morphant embryos compared with wt and the 5-nt mismatch control. White squares in the upper panel denote the higher magnification regions shown in the lower panel. J: Quantification of acridine orange-positive cells in the tail bend and in the entire embryo showing significantly higher numbers of acridine orange-positive cells in the LRRK2 morphants compared with wt and LRRK2 5-base mismatch control embryos. n = 5 for all groups, **P < 0.01. Scale bars = 100 Ám.

