Fig. 4
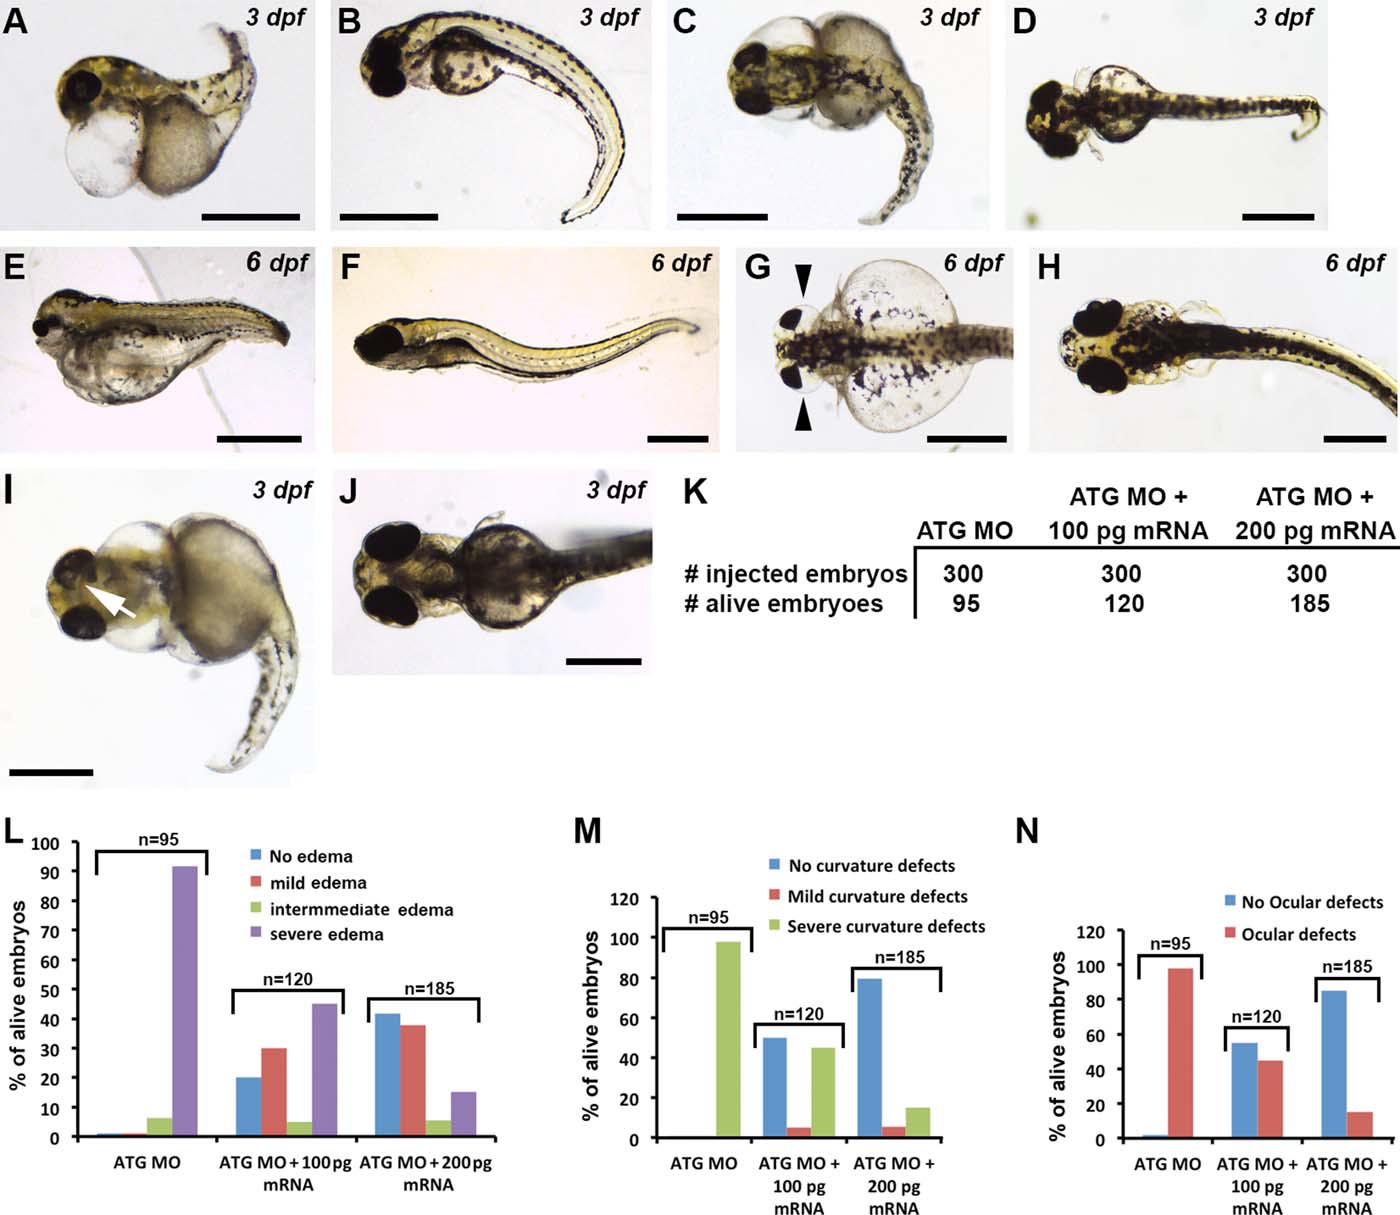
Rescue of the LRRK2 phenotypes by injecting human wt LRRK2 mRNA. A: Lateral view of a 3-dpf embryo injected with 4 ng LRRK2 translational MO showing axis curvature defect. B: Lateral view of a 3-dpf embryo coinjected with 4 ng LRRK2 translational MO and 200 pg human wt LRRK2 mRNA showing normal axis development. C: Dorsal view of a 3-dpf embryo injected with 4 ng LRRK2 translational MO showing axis curvature defect. D: Dorsal view of a 3-dpf embryo coinjected with 4 ng LRRK2 translational MO and 200 pg human wt LRRK2 mRNA showing normal axis development. E: Lateral view of a 6-dpf embryo injected with 4 ng LRRK2 translational MO showing edema in the entire body. F: Lateral view of a 6-dpf embryo coinjected with 4 ng LRRK2 translational MO and 200 pg human wt LRRK2 mRNA showing absence of any kind of edema. G: Dorsal view of a 6-dpf embryo injected with 4 ng LRRK2 translational MO showing distinct edema around the eyes (arrowheads). H: Dorsal view of a 6-dpf embryo coinjected with 4 ng LRRK2 translational MO and 200 pg human wt LRRK2 mRNA showing normal eyes with no edema. I: Ventral view of a 3-dpf embryo injected with 4 ng LRRK2 translational MO showing coloboma (arrow) in the left eye. J: Ventral view of a 3-dpf embryo coinjected with 4 ng LRRK2 translational MO and 200 pg human wt LRRK2 mRNA showing normal eye development. K: The number of embryos injected and the number of embryos alive for three experimental groups: LRRK2 translational (ATG) MO; LRRK2 translational (ATG) MO + 100 pg human wt LRRK2 mRNA and LRRK2 translational (ATG) MO + 200 pg human wt LRRK2 mRNA. L: Embryos were classified into four groups based on edema: no edema, mild edema (general nonspecific heart edema from injections), intermediate edema, and severe edema. Three groups based on curvature defects: no curvature defects, mild curvature defects, severe curvature defects (M) and two groups based on ocular defects: no ocular defects and ocular defects (N). Y-axis shows embryos in the different categories as a percentage of the total No. of embryos alive for embryos injected with 4 ng of translational MO, embryos injected with 4 ng of translational MO + 100 pg human wt LRRK2 mRNA, and embryos injected with 4 ng of translational MO + 200 pg human wt LRRK2 mRNA. n = 95 for translational MO-injected embryos, n = 120 for translational MO + 100 pg mRNA-injected embryos and n = 185 for translational MO + 200 pg mRNA-injected embryos. Scale bars = 0.5 mm.

