
|
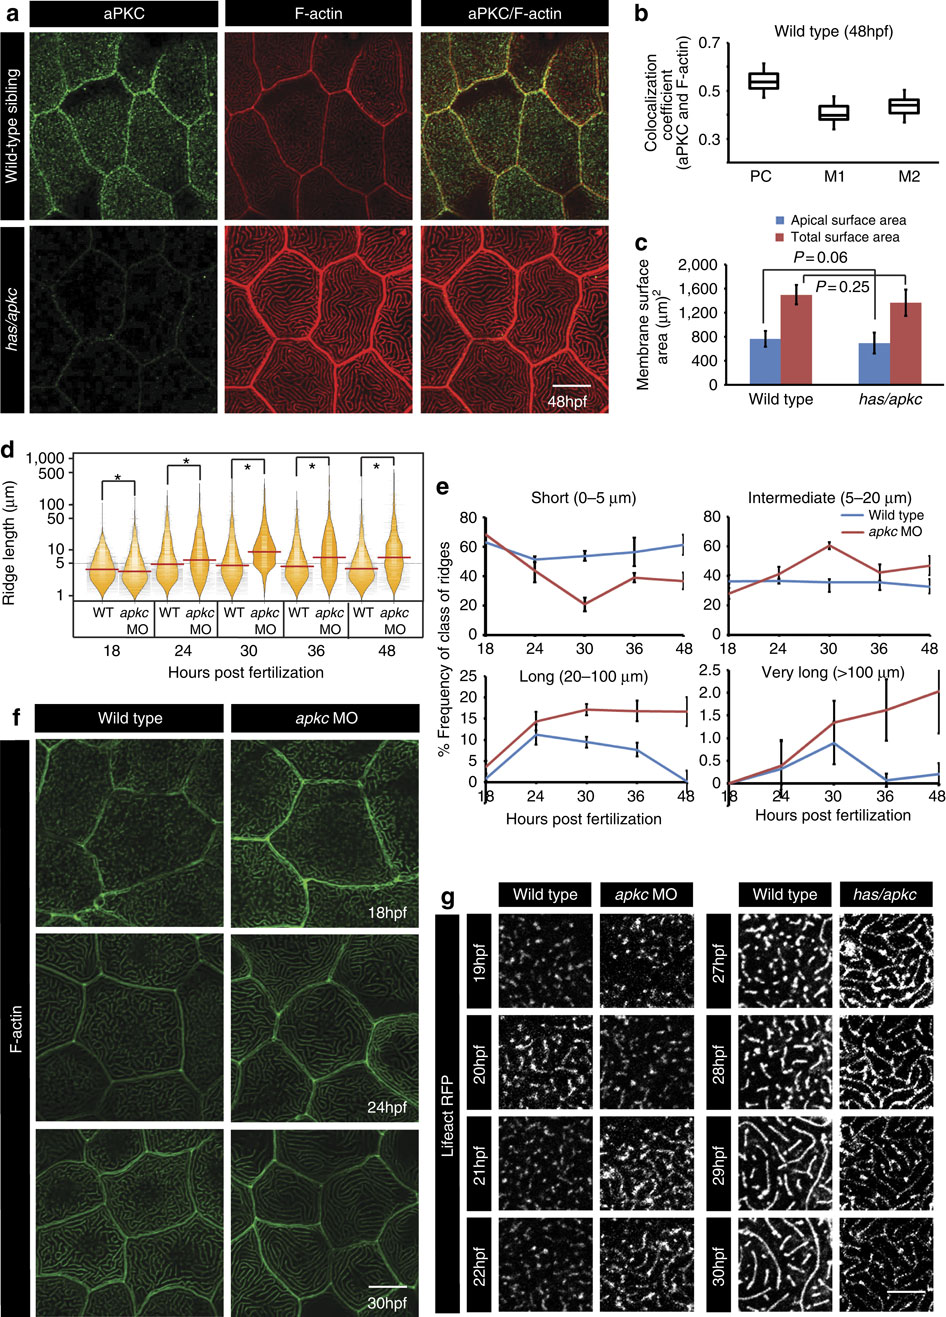
Fig. 1
has/apkc function is important for restricting the length of microridges by preventing their precocious elongation. Immuno-colocalization using anti-aPKC antibody and phalloidin, which labels F-actin, in wild type and has/apkc mutant at 48 hpf (a) followed by colocalization coefficient analysis by Pearson?s (PC) method and Manders? overlap for aPKC with F-actin (M1) and F-actin with aPKC (M2) at 48 hpf in wild-type embryos (b). Graphical representation (c) of apical surface area and total cell surface area in wild type and has/apkc mutant at 48 hpf. Visualization of the distribution of ridge lengths and medians in wild-type and aPKC-deficient embryos at various developmental time points using bean plots (d). The frequency distribution of ridges (e) in short (0-5 �m), intermediate (5-20 �m), long (20-100 �m) and very long (>100 �m) categories during development. Quantification in d and e are based on phalloidin stainings performed in wild-type and apkc morphants (f). Time-lapse imaging of microridges in clones expressing lifeActRFP under CMV promoter in wild-type and apkc morphants during 19-22 hpf and in has/apkc siblings (wild type) and mutants during 27-30 hpf (g). Error bars in c and e indicate s.d., whereas square brackets represent comparison. Probability values ?P? are for the Student?s t-test. Asterisks in the bean plot (d) represent significant difference in median values at P<0.05 as calculated by pairwise multiple comparison procedures using Dunn?s Method. Scale bars in a,f and g correspond to 10 �m.