Image
Figure Caption
Fig. 6
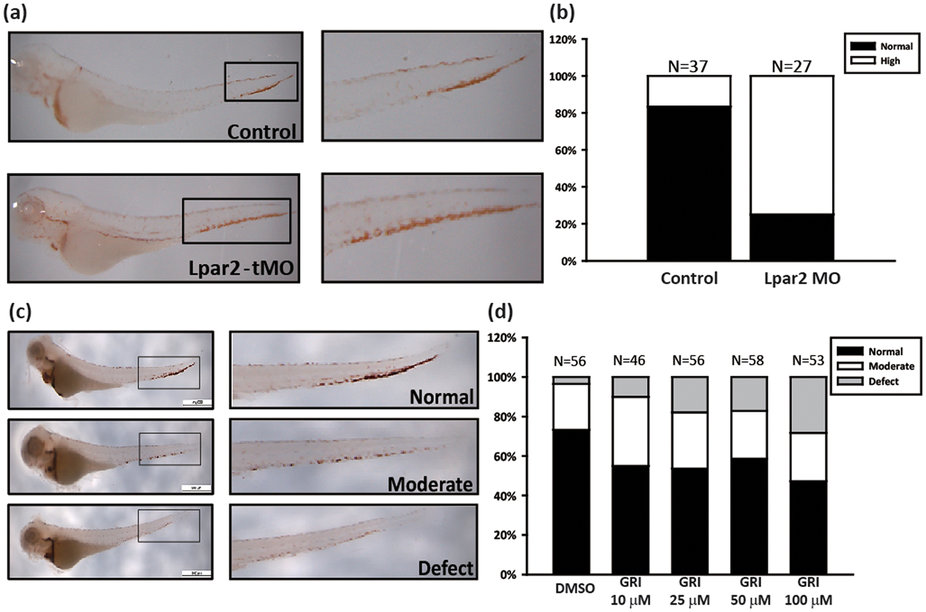
Characterization of the effects of LPA2 during definitive erythropoiesis.
The effects of LPAR2 MO revealed defective erythropoiesis in the CHT region based on o-dianisidine staining. (b) The quantitative results for (a). (c) The effects of the LPA2 agonist GRI after treatment for 96 h. O-dianisidine staining levels were classified as normal, moderate, or defective based on the expression levels in the embryonic blood. (d) The quantification hemoglobin expression after treatment with different concentrations of GRI for four days.
Figure Data
Acknowledgments
This image is the copyrighted work of the attributed author or publisher, and
ZFIN has permission only to display this image to its users.
Additional permissions should be obtained from the applicable author or publisher of the image.
Full text @ Sci. Rep.

