
|
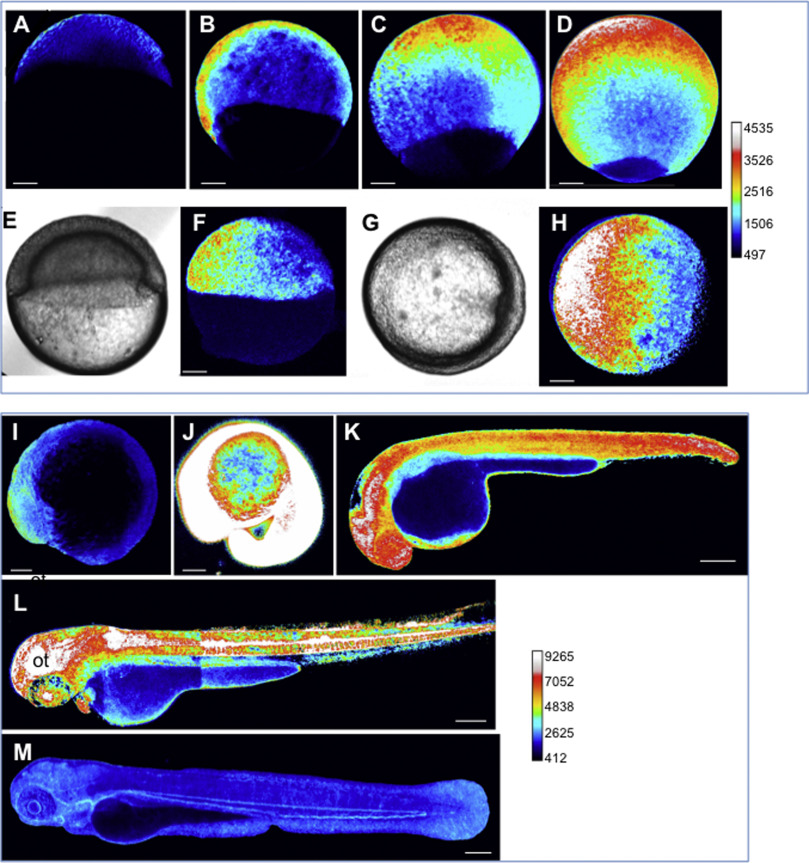
Fig. 1
Dynamics of the H2O2 levels during development. HyPer imaging in developing zebrafish embryos. The H2O2 levels are inferred from the YFP500/YFP420 excitation ratio of HyPer. (A) Blastula, (B-H) gastrulation. (E-H) During gastrulation, H2O2 is detected at the opposite side of the shield (E-H). (E, G) Bright-field images corresponding to F and H, respectively. (I) Early somitogenesis, (J) 20 somites (K) 30 hpf, (L) 48 hpf, (M) 72 hpf. Representative images are shown as lateral views, except for those in G-H (animal view). Pseudo-colour calibration bars: HyPer ratio (YFP500/YFP420). The bar common for A-H and the bar common for I-M allow the H2O2 levels in each group to be compared. Scale bars, 100 µm (A-J) and 200 µm (K-M). ot: optic tectum.
Reprinted from Developmental Biology, 414(2), Gauron, C., Meda, F., Dupont, E., Albadri, S., Quenech'Du, N., Ipendey, E., Volovitch, M., Del Bene, F., Joliot, A., Rampon, C., Vriz, S., Hydrogen peroxide (H2O2) controls axon pathfinding during zebrafish development, 133-41, Copyright (2016) with permission from Elsevier. Full text @ Dev. Biol.