Fig. 7
Klf2a expression regulates fibronectin synthesis in the AVC to drive valve formation.
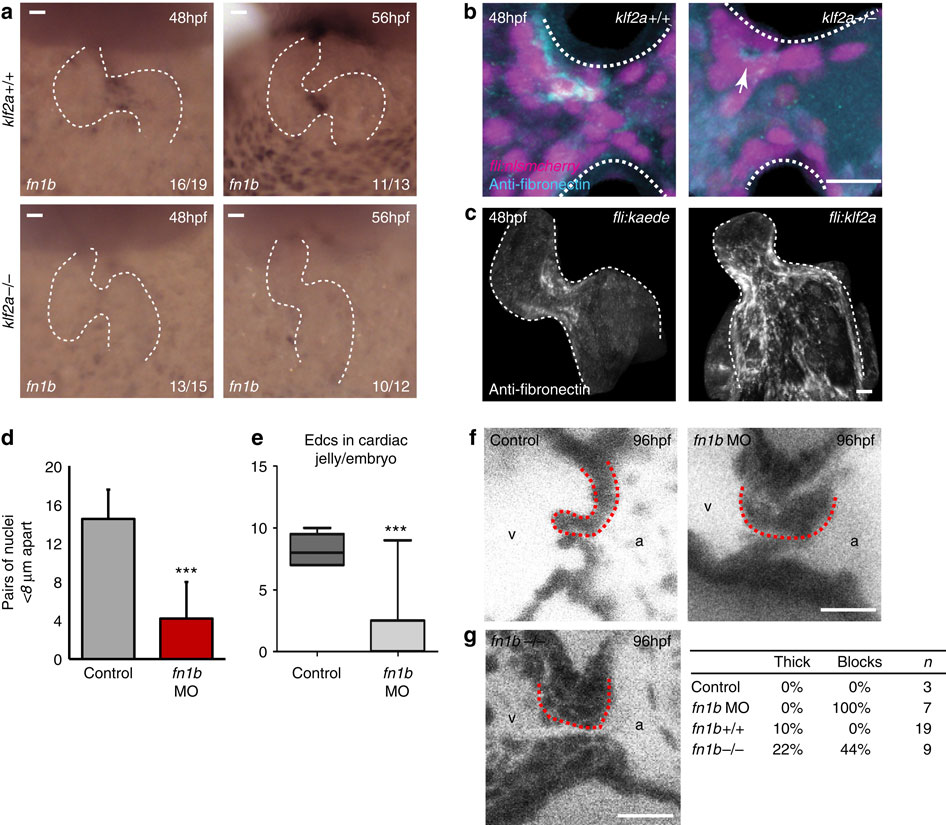
(a) in situ hybridization analysis shows the fn1b mRNA expression in the AVC of klf2a+/+ embryos, at 48 and 56 hpf, is lost in the majority of klf2a-/- embryos. (b) Immunofluorescence analysis shows reduced fibronectin-positive staining (cyan) in the AVC of klf2a-/- mutants (n=12 klf2+/+, n=18 klf2a-/-). A z-projection of the whole AVC is shown. (c) Forced expression of Klf2a in EdCs using the Tg(fli:gal4FFubs; UAS:klf2a) line results in fibronectin-positive staining in the atrium and ventricle (n=12/16) compared with the AVC-specific staining pattern in controls (n=12/14) in at least three independent experiments. A z-projection of the whole heart is shown. (d) Analysis of fn1b morphants showed defective cell clustering in the superior AVC at 48 hpf (control n=6, fn1bMO n=5) and (e) reduced numbers of nuclei in the cardiac jelly at 72 hpf (control n=5, fn1bMO n=9). (f) Live imaging of valves at 96 hpf showed leaflets fail to form in fn1b morphants (controls n=3, fn1bMO n=7). Single frames from the live imaging are shown and red dotted lines outline the superior valve leaflet in each case. The ventricle (v) and atrium (a) are labelled for orientation. (g) Single frames from the live imaging of fn1b-/- mutant hearts, quantification of the percentage of thick/blocked valves observed in fn1b MO, fn1b-/- mutant hearts and their respective controls. Student?s t-test ***P<0.005, **P<0.01, *P<0.05. Scale bars, 10 Ám.

