Fig. 1
The cellular contribution of heart chambers to emerging valve leaflets.
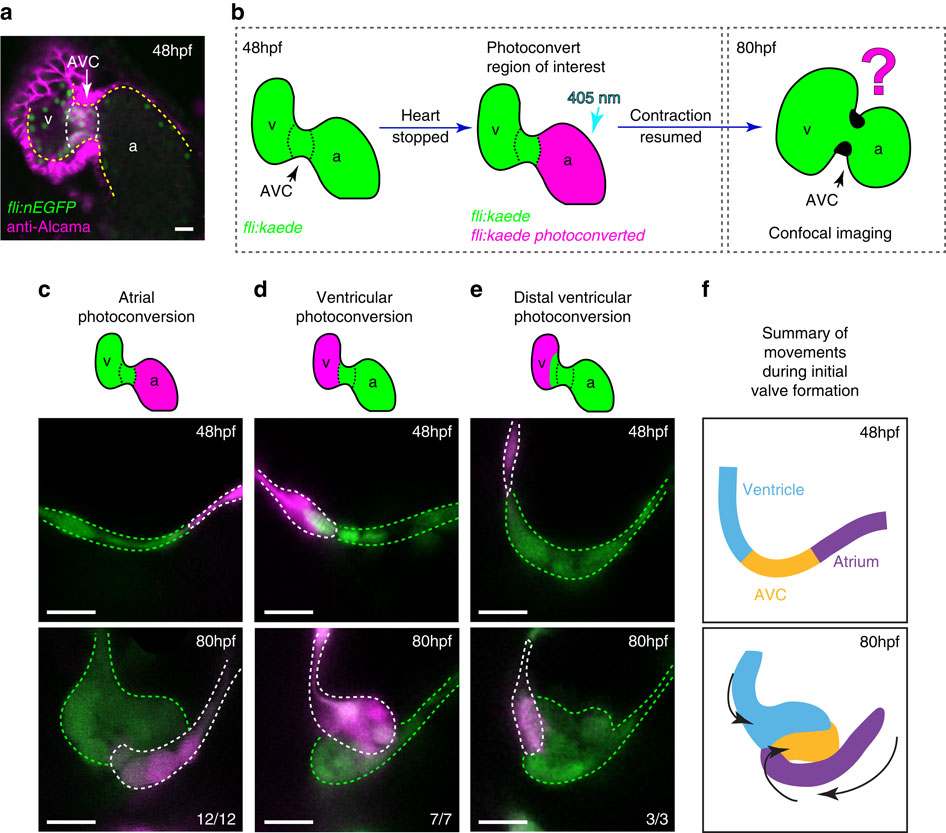
(a) anti-Alcama immunofluorescence analysis shows Alcama-positive EdCs in the AVC of fli:nEGFP hearts (white dotted line), used to define the cardiac chambers at 48 hpf. Yellow dashed line delineates the endocardium from the myocardium, which also stains positively for Alcama. v=ventricle, a=atrium, AVC=atrioventricular canal. (b) The experimental set-up for the photoconversion studies. Heart contraction was stopped in fli:kaede embryos at 48 hpf, the region of interest exposed to 405 nm light to convert kaede from a green to red (shown here to be the atrium, in magenta) fluorescent form and heart contraction was then resumed until 80 hpf. Stopped hearts were imaged at 80 hpf by confocal microscopy. (c) EdCs present in the atrium and Alcama-negative at 48 hpf lined the lumen of the AVC at 80 hpf (n=12/12, 3 experiments), while those in the ventricle contribute cells to the cardiac jelly (d; n=7/7, 3 experiments). Ventricular cells outside the ventricular inner curvature (distal ventricle) do not enter the cardiac jelly at 80 hpf (e; n=3/3, 2 experiments). In all cases only the superior valve leaflet is shown. (f) Schematic representation of the cellular contributions of each chamber to the emerging valve leaflet at 80 hpf. Atrial cells (purple) line the lumen of the AVC, while EdCs originating in the ventricular inner curvature (blue) and AVC (yellow) contribute cells to the cardiac jelly. Black arrows highlight the coordinated movements of the groups of cells. Scale bars, 10 Ám.

