
Image
|
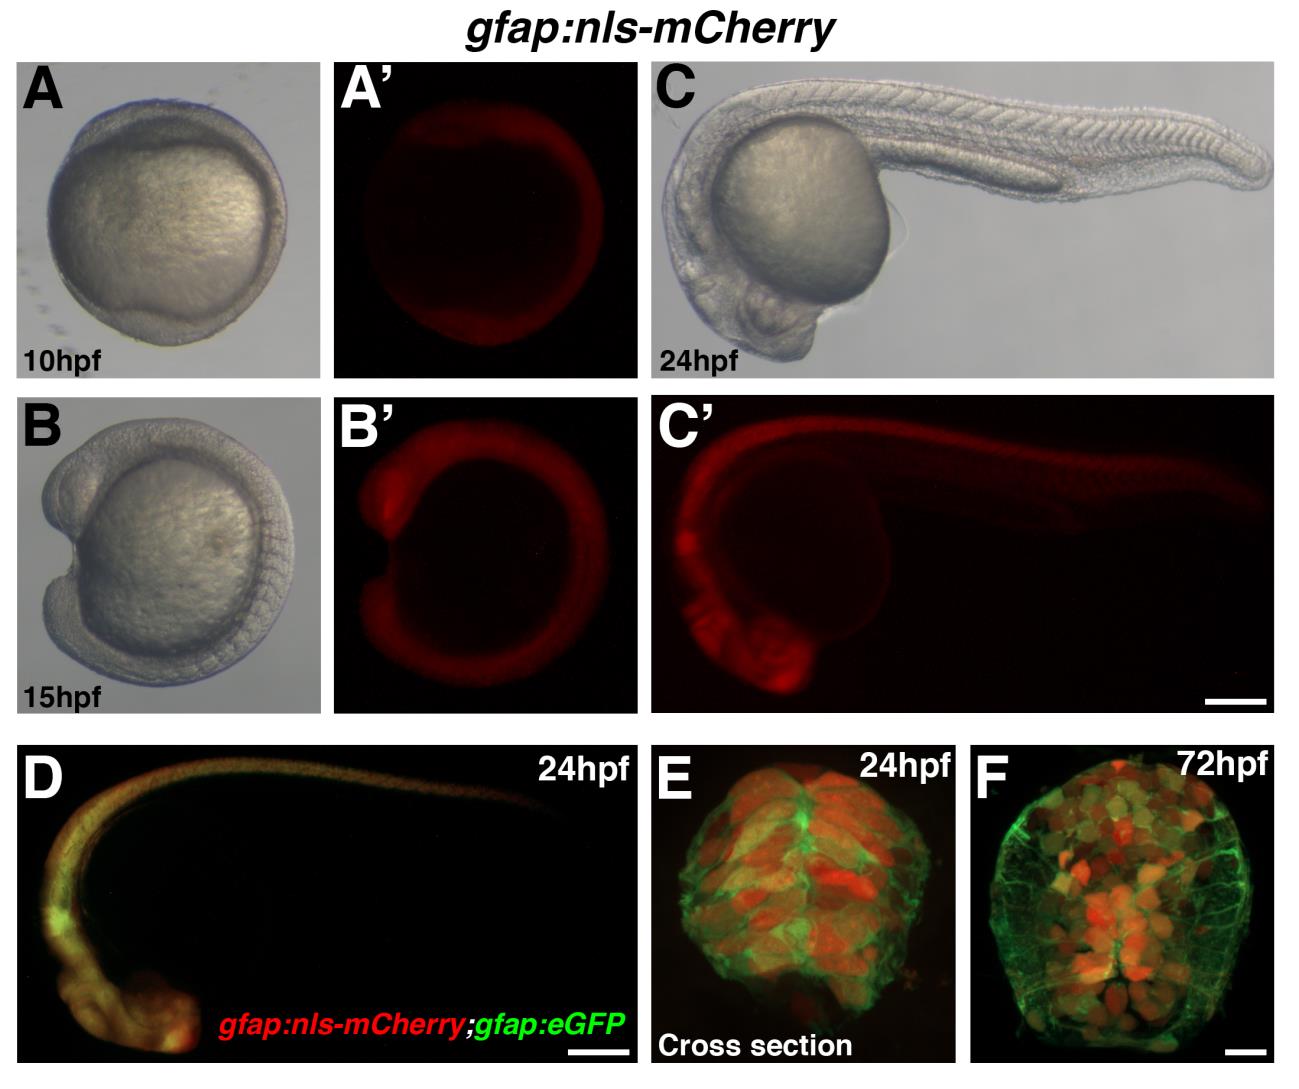
Figure Caption
Fig. S1
Temporal increase in transgene expression within the gfap:nlsmCherry line. Brightfield and fluorescent images of gfap:nls-mCherry embryos. Scale bar = 100�m. (D-F) Coexpression of gfap:nls-mCherry and gfap:eGFPmi2001 lines. Scale bar = 10�m.
Acknowledgments
This image is the copyrighted work of the attributed author or publisher, and
ZFIN has permission only to display this image to its users.
Additional permissions should be obtained from the applicable author or publisher of the image.
Full text @ Glia