
|
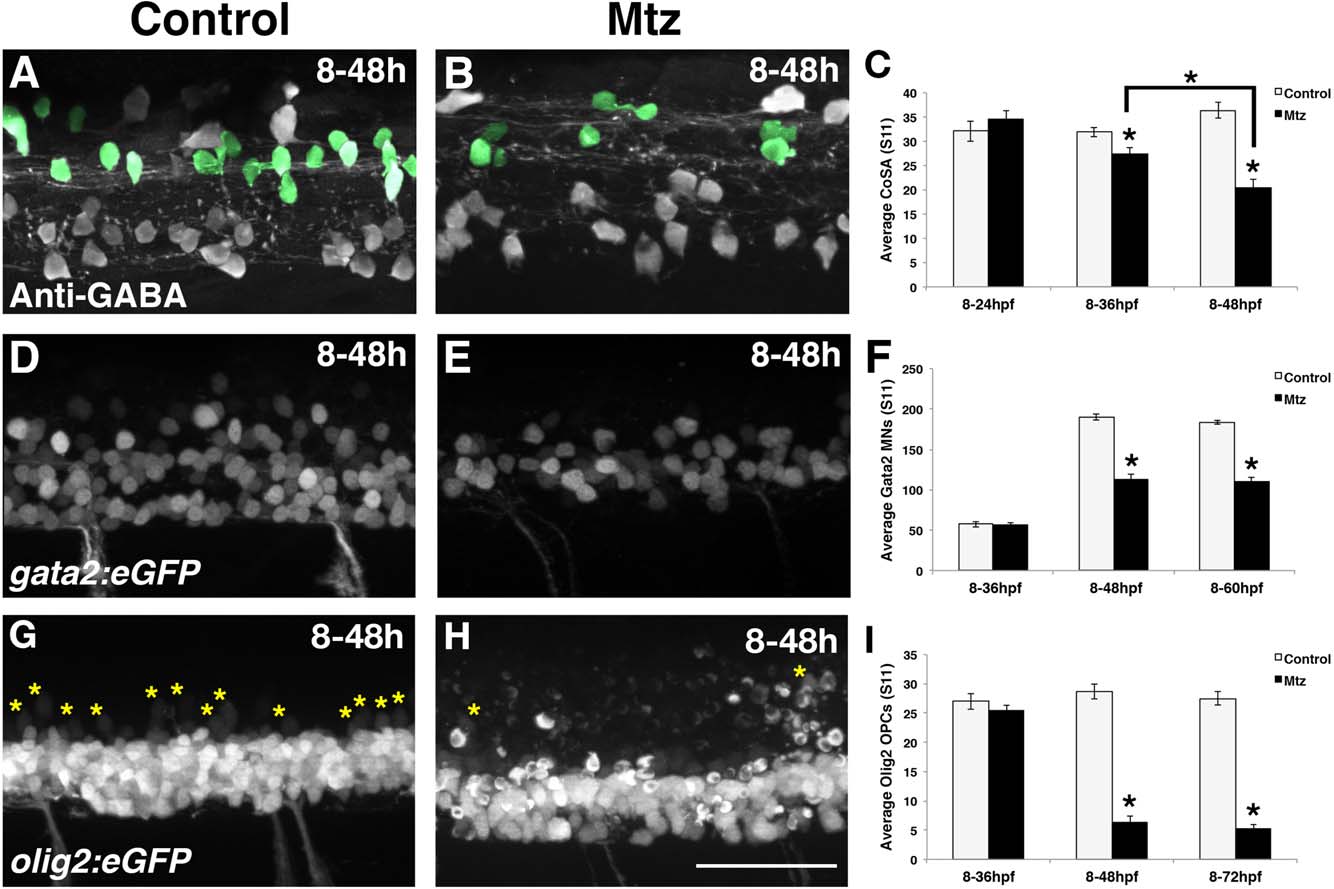
Fig. 8
Reductions in later-born neurons and glia following radial glial ablation. (A, B) Lateral views of spinal cords showing interneurons immunolabeled with anti-GABA within control and Mtz-treated gfap:nfsb-mCherrysc129 embryos and quantified in (C). CoSA interneurons are highlighted in green. (D, E) Lateral views of secondary motorneurons within control and Mtz-treated gfap:nfsb-mCherrysc059;gata2:eGFP embryos and quantified in (F). (G, H) Lateral views of oligodendrocyte progenitor cells (OPCs, yellow asterisks) in control and Mtz-treated gfap:nfsb-mCherrysc059;olig2:eGFP embryos and quantified in (I). Black asterisks denoted significance. Scale bar = 50 �m.