
|
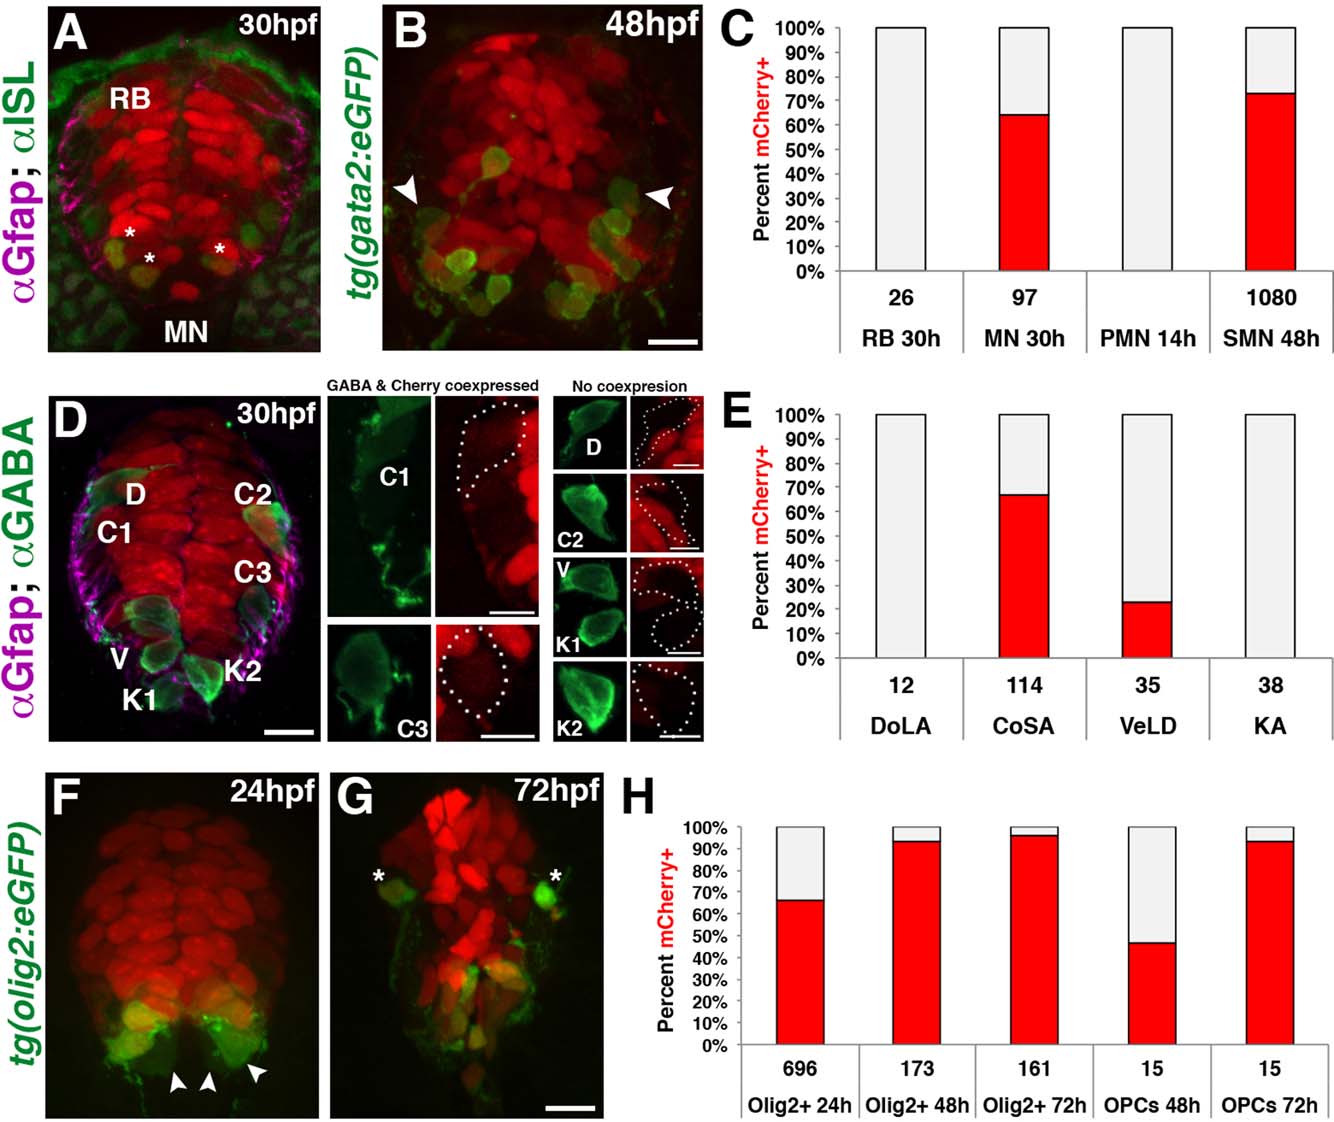
Fig. 3
Fate mapping of gfap-expressing radial glia in the spinal cord. (A) Cross section of a 30 hpf gfap:nls-mCherry embryo immunolabeled with anti-Islet-1 (ISL), showing nls-mCherry is absent in RB sensory neurons but present in a subpopulation of MNs (asterisks). (B) Cross section of a 48 hpf gfap:nls-mCherry;gata2:eGFP embryo showing secondary motorneurons (SMN) expressing GFP. Cells absent for nls-mCherry are denoted (arrowheads). Scale bar = 10 �m. (C) Quantification for the percentage of sensory (RB), total ISL+ MNs, primary motorneurons (PMN), and secondary motorneurons (SMN) retaining nls-mCherry+ nuclei (red). (D) Cross section of a 30 hpf gfap:nls-mCherry embryo immunolabeled with anti-GABA to identify DoLA (D), CoSA (C), VeLD (V), and KA (K) interneurons. Subset Z-stacks and maximum intensity projections were generated for each neuronal population for clarity. Scale bar = 10 �m. (E) Quantification of the percentage of each interneuron population expressing nls-mCherry+ nuclei (red) at 30 hpf. (F, G) Cross sections of 24 and 72 hpf double transgenic gfap:nls-mcherry;olig2:eGFP embryos showing ventral Olig2+ populations as well as dorsal OPCs (asterisks). Scale bar = 10 �m. (H) Quantification of the percentage of ventral Olig2+ cells along with dorsal migrating OPCs that retain nls-mCherry+ nuclei (red) throughout oligodendroglial development. In all graphs, nls-mCherry negative cells are depicted in gray, and the numbers below each population represent the total number of cells assayed.