Fig. 1
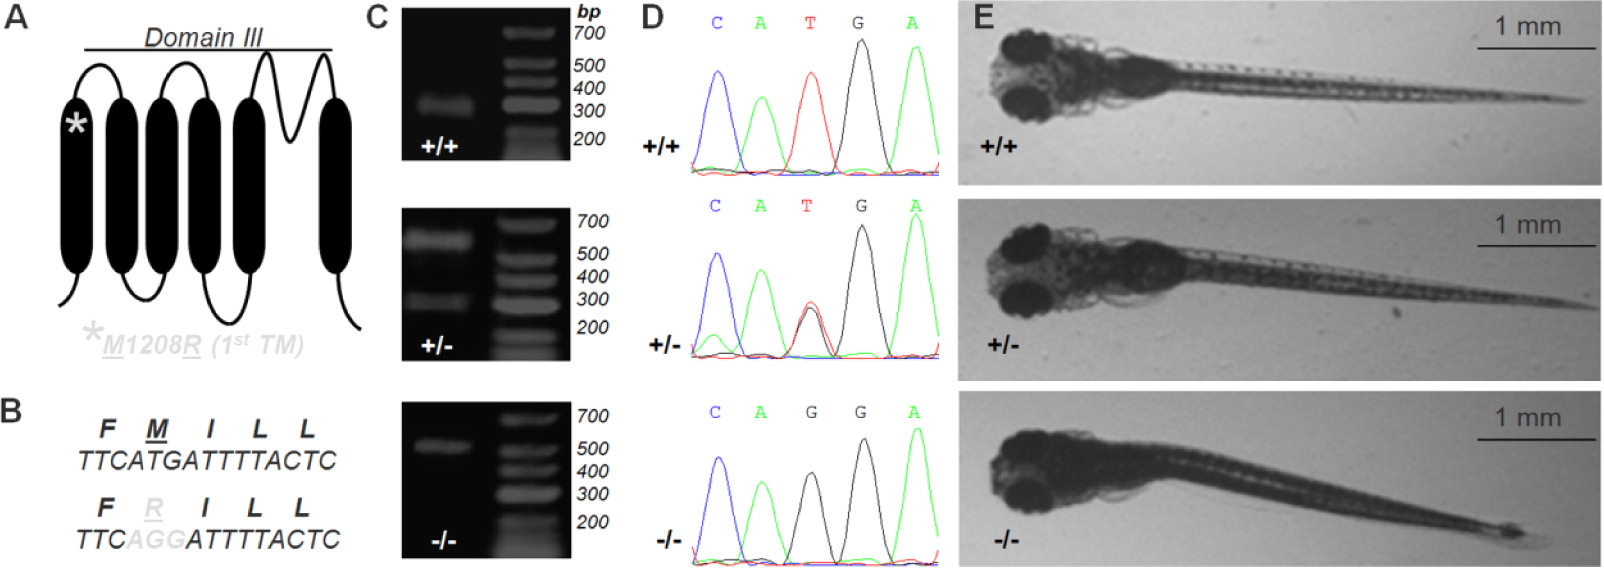
Genotyping and characterization of the scn1Lab mutation. (A) Location of the point mutation in the scn1Lab gene, more specifically in the first transmembrane segment (1st TM) in domain III (indicated by an asterisk). (B) T-G substitution in scn1Lab mutants changes methionine (M) to arginine (R). Genotypes are indicated by +/+ for WT (scn1Lab+/+), +/- for heterozygous (scn1Lab±), and /- for homozygous (scn1Lab-/-). (C) Restriction endonuclease analysis of amplicons yielded bands of 250 basepairs (bp) in wild types, 250 and 500 bp in heterozygous scn1Lab± mutants, and 500 bp in homozygous scn1Lab-/- mutants (reference on the right: low range DNA ladder, highest band 700 bp). (D) Sequencing data confirmed the genetic difference of WT scn1Lab+/+, heterozygous scn1Lab± mutants, and homozygous scn1Lab-/- mutants. (E) No phenotypic difference between WT scn1Lab+/+ and heterozygous scn1Lab± mutants was observed. Homozygous scn1Lab-/- larvae on the contrary showed a darker appearance, lack of a swim bladder, and slight curvature of the body.

