Fig. 2
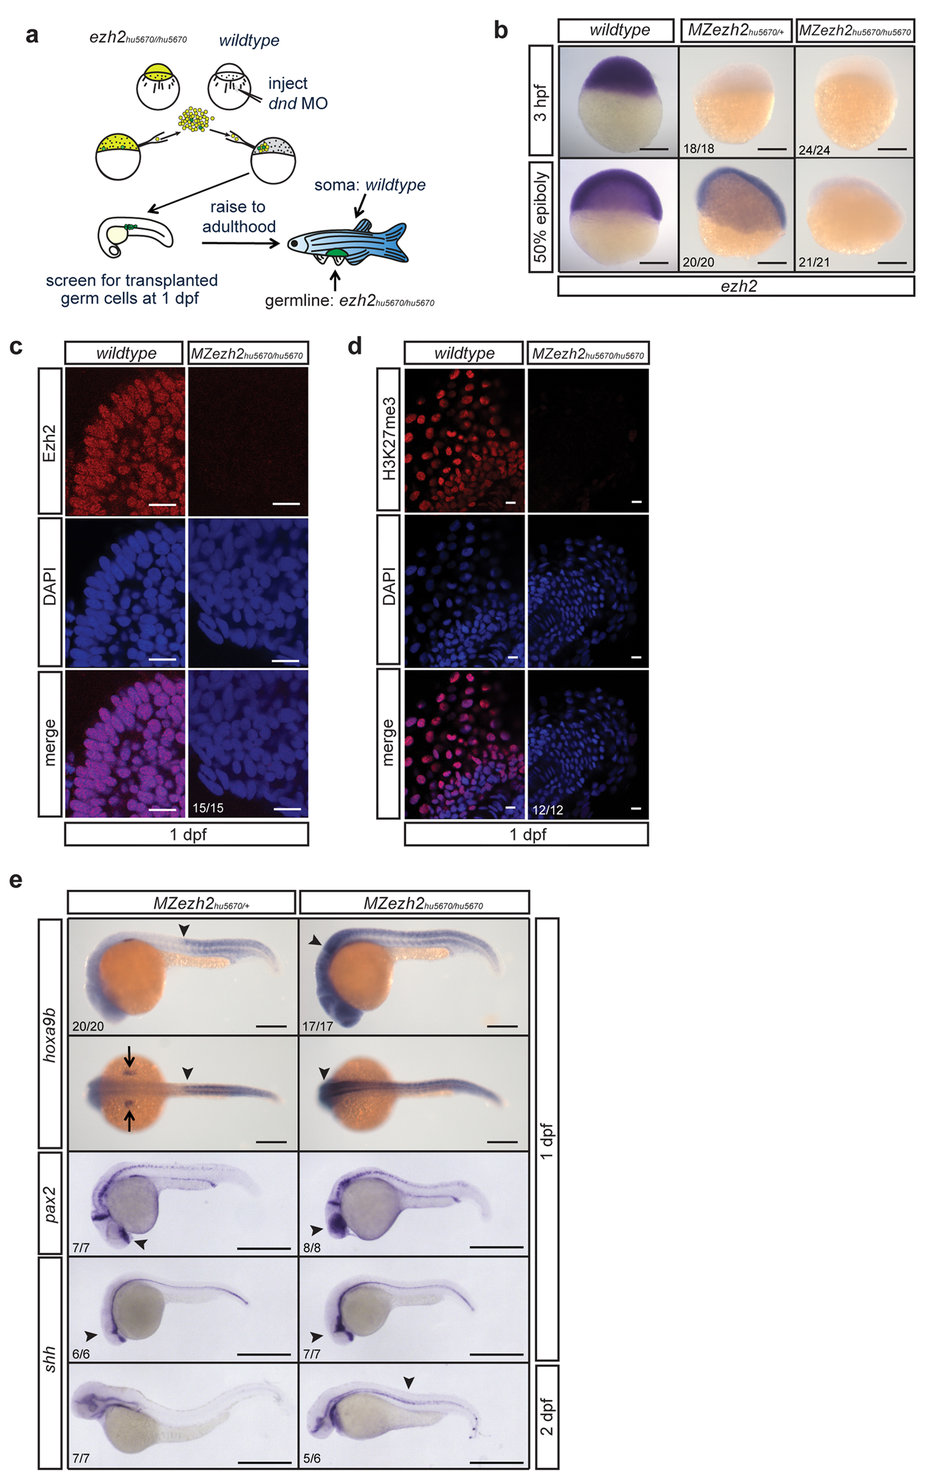
Maternal zygotic ezh2 mutant embryos lack Ezh2 and H3K27me3, and show aberrant hox, pax, and shh gene expression.
(a) Schematic representation of germline transplantation at sphere stage to obtain germline mutant zebrafish. The progeny are maternal zygotic ezh2 mutant embryos (MZezh2hu5670/hu5670). (b) In situ hybridization for ezh2 mRNA shows maternal contribution of ezh2 as well as zygotic expression in wildtype embryos. Maternal contribution of ezh2 is lost (3 hpf) in MZezh2hu5670/+ and MZezh2hu5670/hu5670 embryos. Zygotic ezh2 expression (30% epiboly) is also lost in MZezh2hu5670/hu5670. Scale bar is 200 Ám. (c) Immunostaining for Ezh2 in wildtype and MZezh2hu5670/hu5670 embryos at 1 dpf. Ezh2 shows representative nuclear localization in the forebrain of wildtype embryos and is lost in MZezh2hu5670/hu5670 embryos. Scale bar is 10 Ám. (d) Immunostaining for H3K27me3 in wildtype and MZezh2hu5670/hu5670 embryos at 1 dpf. H3K27me3 shows representative nuclear localization in the tail of wildtype embryos and is lost in MZezh2hu5670/hu5670 embryos. Scale bar is 10 Ám. (e) In situ hybridization for hoxa9b, pax2, and shh mRNA in MZezh2hu5670/+ and MZezh2hu5670/hu5670 embryos at 1 and 2 dpf. In MZezh2hu5670/+ embryos a clear boundary of hoxa9b expression is visible (arrow head) as well as expression in the pectoral fin buds (arrows). Expression is shifted to anterior in MZezh2hu5670/hu5670 embryos (arrow head). The expression pattern of hoxa9b in MZezh2hu5670/+ resembles that of wildtype embryos54. Scale bar is 200 Ám. In MZezh2hu5670/+ embryos expression of pax2 is normal and amongst others restricted to the optic stalk, mid-hindbrain boundary, and the spinal cord neurons32. Expression in the optic stalk is spread throughout the eye in MZezh2hu5670/hu5670 embryos. Expression of shh is comparable to wildtype embryos in MZezh2hu5670/+ embryos at 1 and 2 dpf31. In MZezh2hu5670/hu5670 embryos, expression of shh is outside the regular boundaries in the head region (arrow head) at 1 dpf and is still present at 2 dpf in the notochord, in contrast to MZezh2hu5670/+ embryos (arrow head). Scale bar is 500 Ám. The numbers indicate the number of embryos with the displayed phenotype compared to the total number of embryos analyzed.

