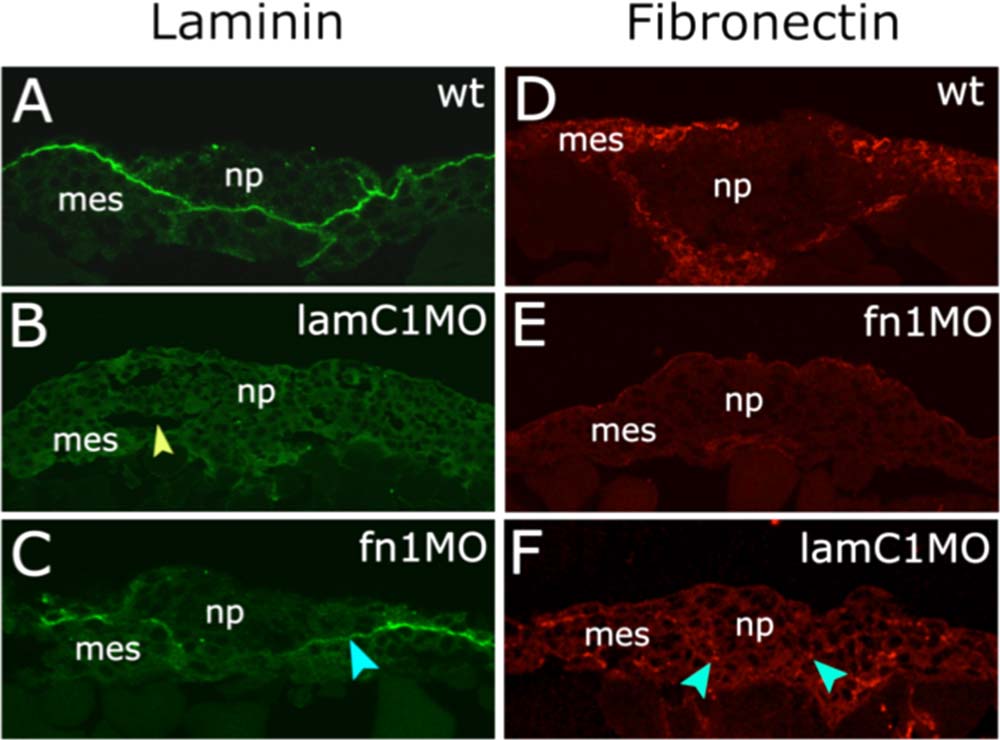
Fig. 2
lamininC1 and fibronectin1 morpholino efficiencies at neural plate stages. A-F: Transverse sections of zebrafish embryos at 11.5 hpf. Laminin immunoreactivity is shown in green in A, B, and C. Fibronectin immunoreactivity is shown in red in D, E, and F. A: Lam reactivity at 11.5 hpf between neural plate and mesoderm. B: Reduction of Lam by lamC1 MO (arrowhead indicate tissue gaps between neural plate and mesoderm). C: After fn1MO, Lam reactivity shows slightly reduced levels (arrowhead). D: Fn reactivity at 12 hpf. E: fn1MO strongly reduces Fn expression. F: After lamC1MO, Fn reactivity shows reduced levels (arrowheads). np, neural plate; mes, mesoderm; hpf, hours post fertilization.

