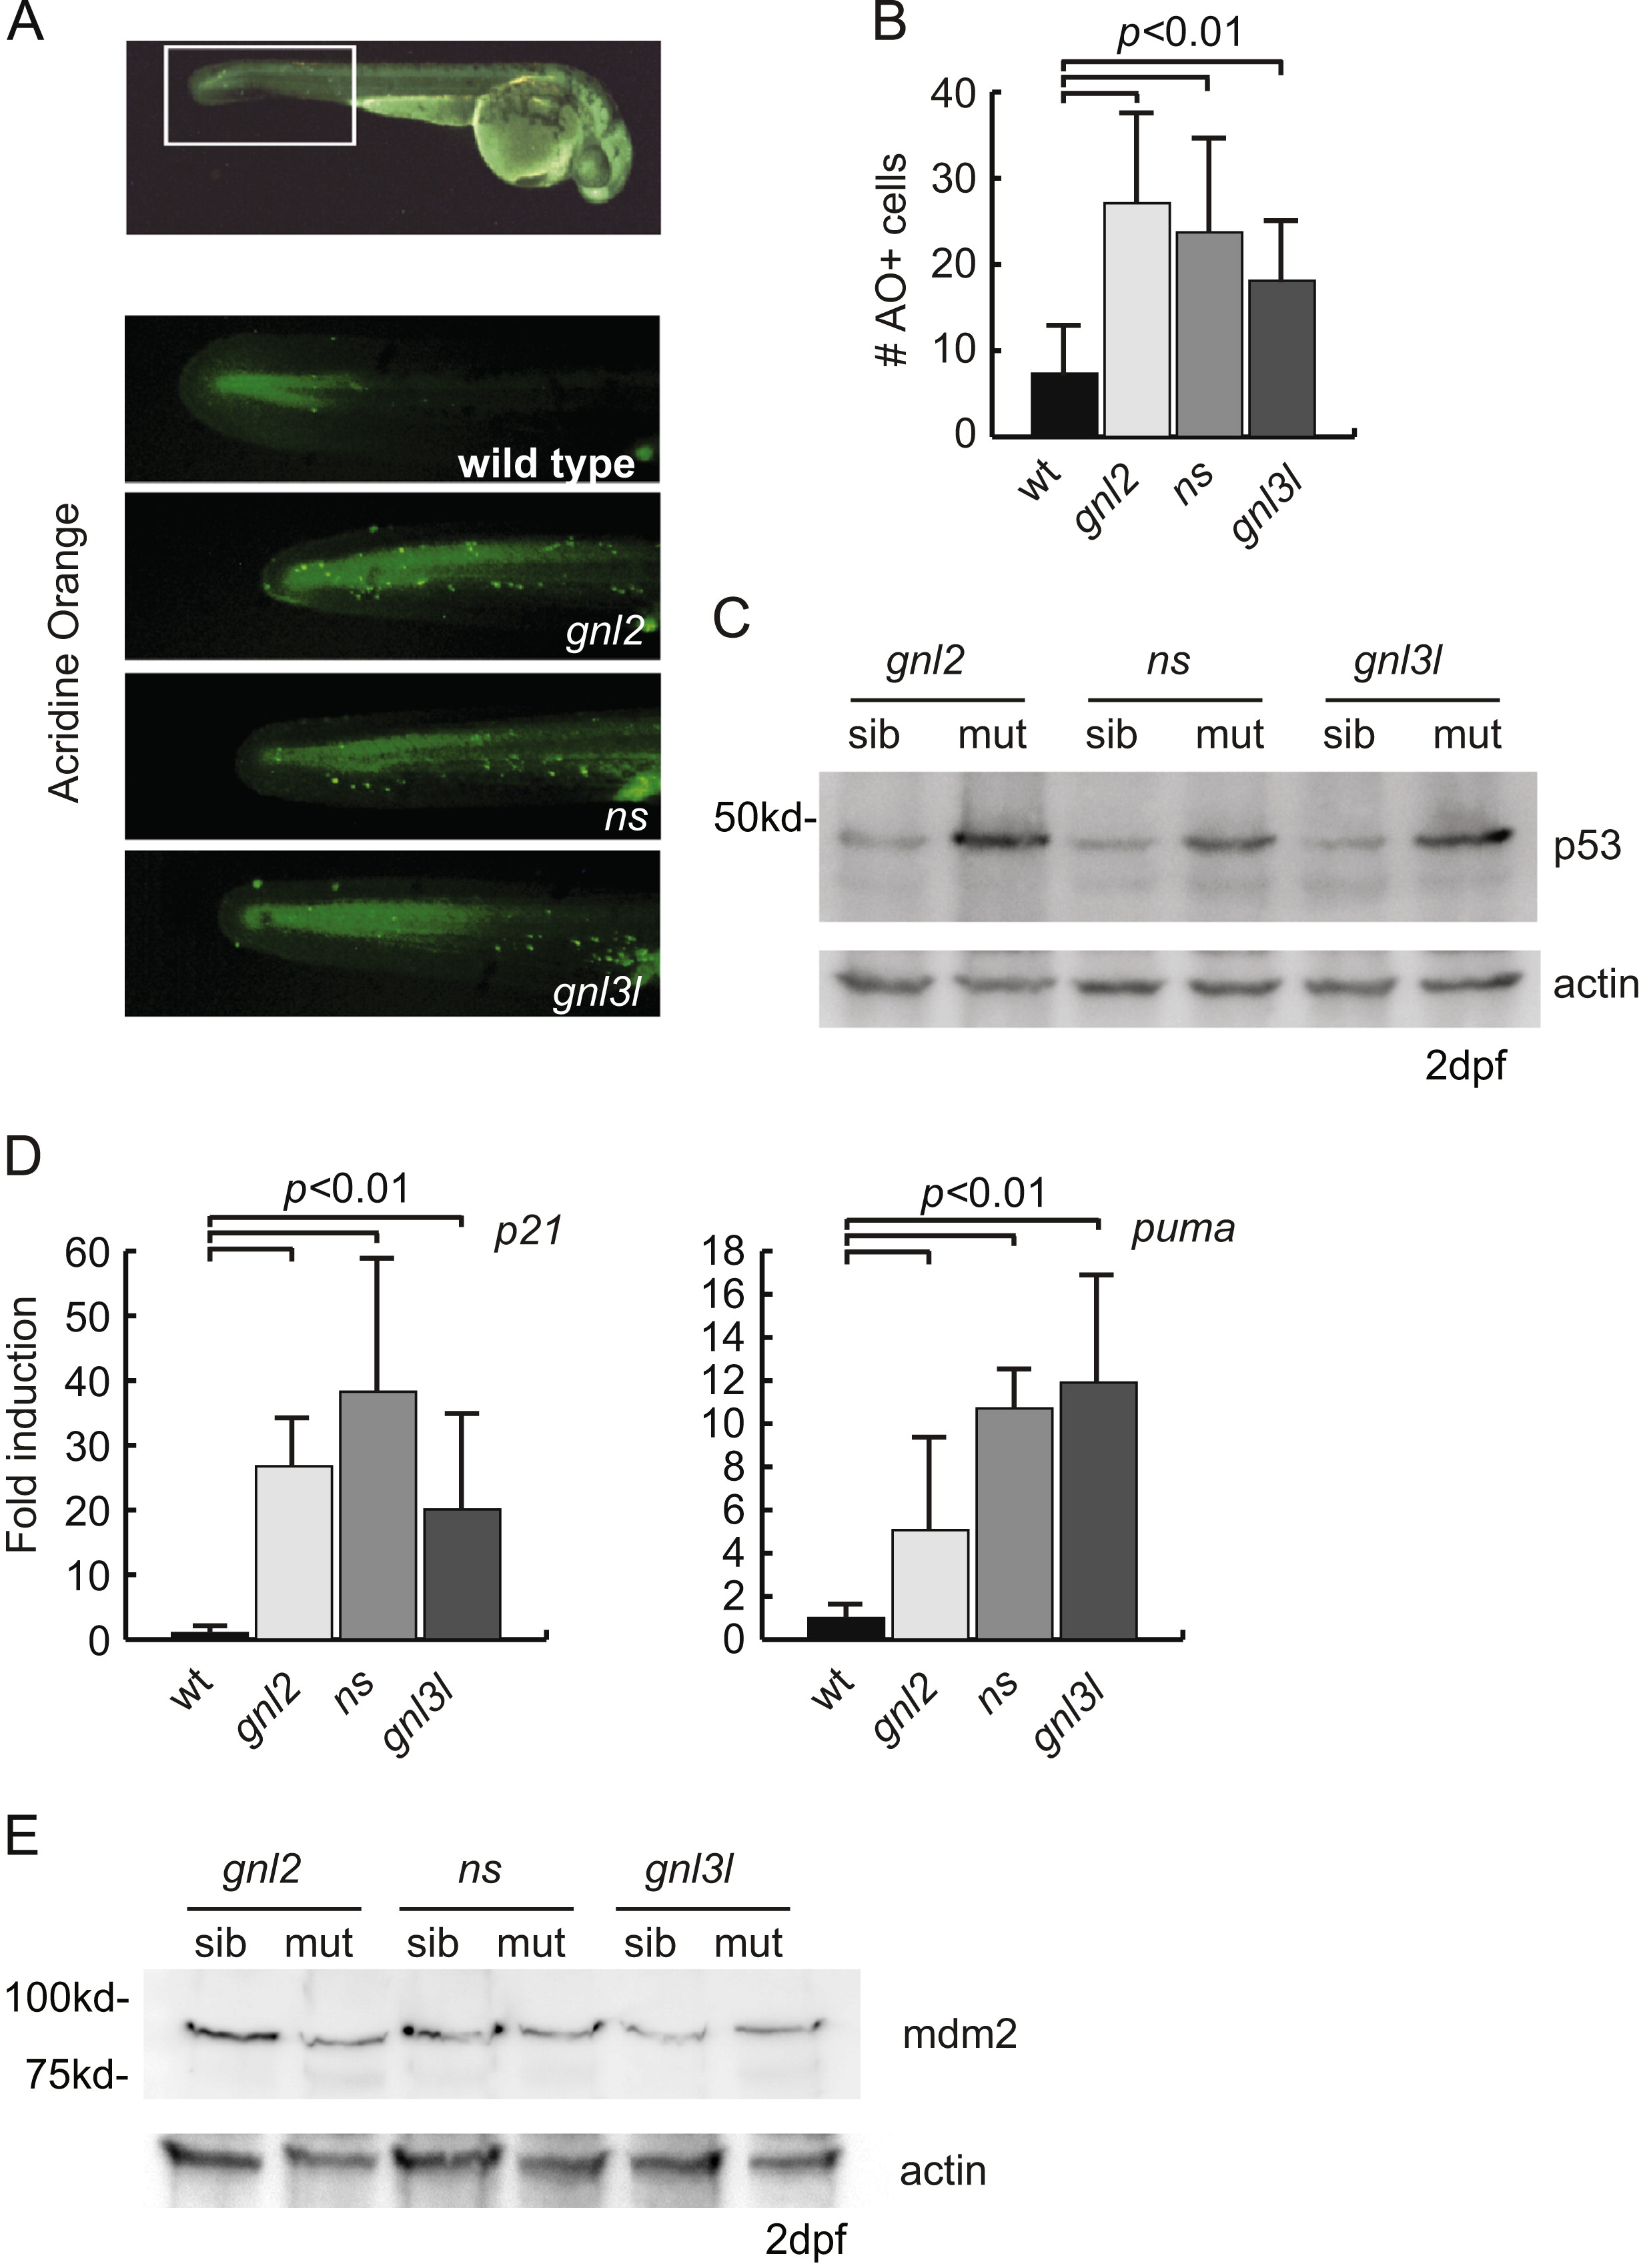
Fig. 5
p53 induced apoptosis in ns family mutants. (A) Representative fluorescent microscopy images showing acridine orange staining at 1 dpf. The top box illustrates with the white box the portion of the tail used for quantification of acridine orange positive cells. (B) Quantifications of the number of acridine orange positive cells. At least 7 animals were blindly scored for these quantifications. p<0.01 by Student′s two-tailed t-test. (C) Western blot analysis of p53 stabilization in all three mutant lines at 2 dpf. (D) qPCR analysis of p21 and puma transcript levels at 2 dpf, normalized to ef1α expression. p<0.01 by Student′s two-tailed t-test. (E) Western blot analysis of zebrafish mdm2 levels in mutants and wild type siblings at 2 dpf.
Reprinted from Developmental Biology, 385(2), Essers, P.B., Pereboom, T.C., Goos, Y.J., Paridaen, J.T., and Macinnes, A.W., A comparative study of nucleostemin family members in zebrafish reveals specific roles in ribosome biogenesis, 304-15, Copyright (2014) with permission from Elsevier. Full text @ Dev. Biol.

