
|
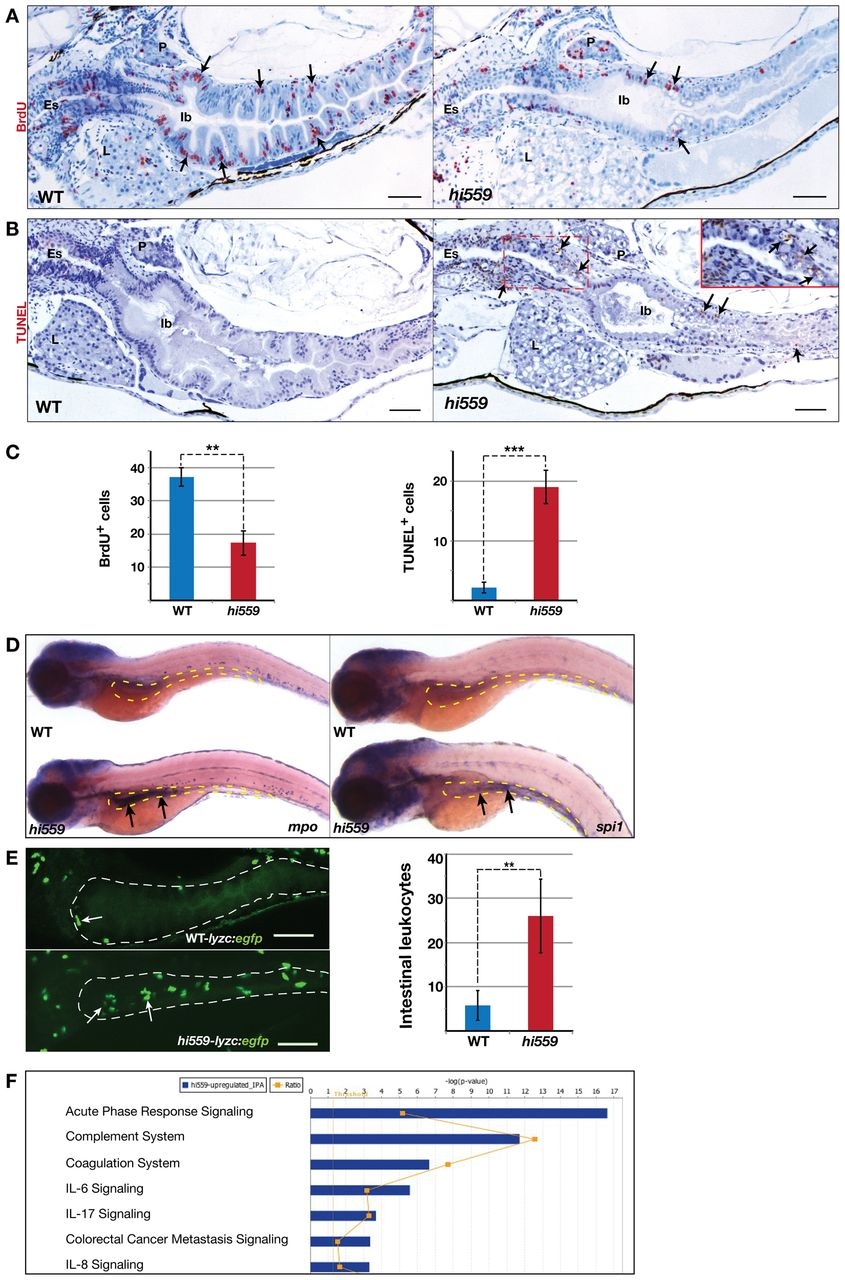
Fig. 3
Abnormal cell proliferation, apoptosis and inflammation in hi559 intestine. (A) BrdU staining (red) shows decreased proportion of proliferating cells (arrows) in the hi559 intestine compared with wild type (WT). (B) TUNEL staining (brown) shows several apoptotic cells in hi559 GI tract (red box indicates esophageal GC region magnified in inset). (C) Bar charts showing the proportion of BrdU-positive cells at 5 dpf (left), and TUNEL-positive cells at 6 dpf (right; n=8). (D) ISH showing increased expression (arrows) of neutrophil marker mpo (left) and macrophage marker spi1 (right) in hi559 intestines (yellow outline) at 6 dpf. (E) Confocal projections of 6-dpf Tg(lyzc:egfp) and hi559Tg(lyzc:egfp) larval intestines (white outline), showing leukocyte aggregation (arrows). Bar chart shows the number of leukocytes in wild-type and hi559 intestines at 6 dpf (n=12). (F) IPA analysis of microarray profile showing most significantly upregulated pathways in hi559 larvae (n=3, Pd0.01). Es, esophagus; Ib, intestinal bulb; P, pancreas; L, liver. **P<0.01, ***P<0.001. Scale bars: 20 �m.