Fig. 2
Gmnc Functions Downstream of Notch Activation and Upstream of mcidas
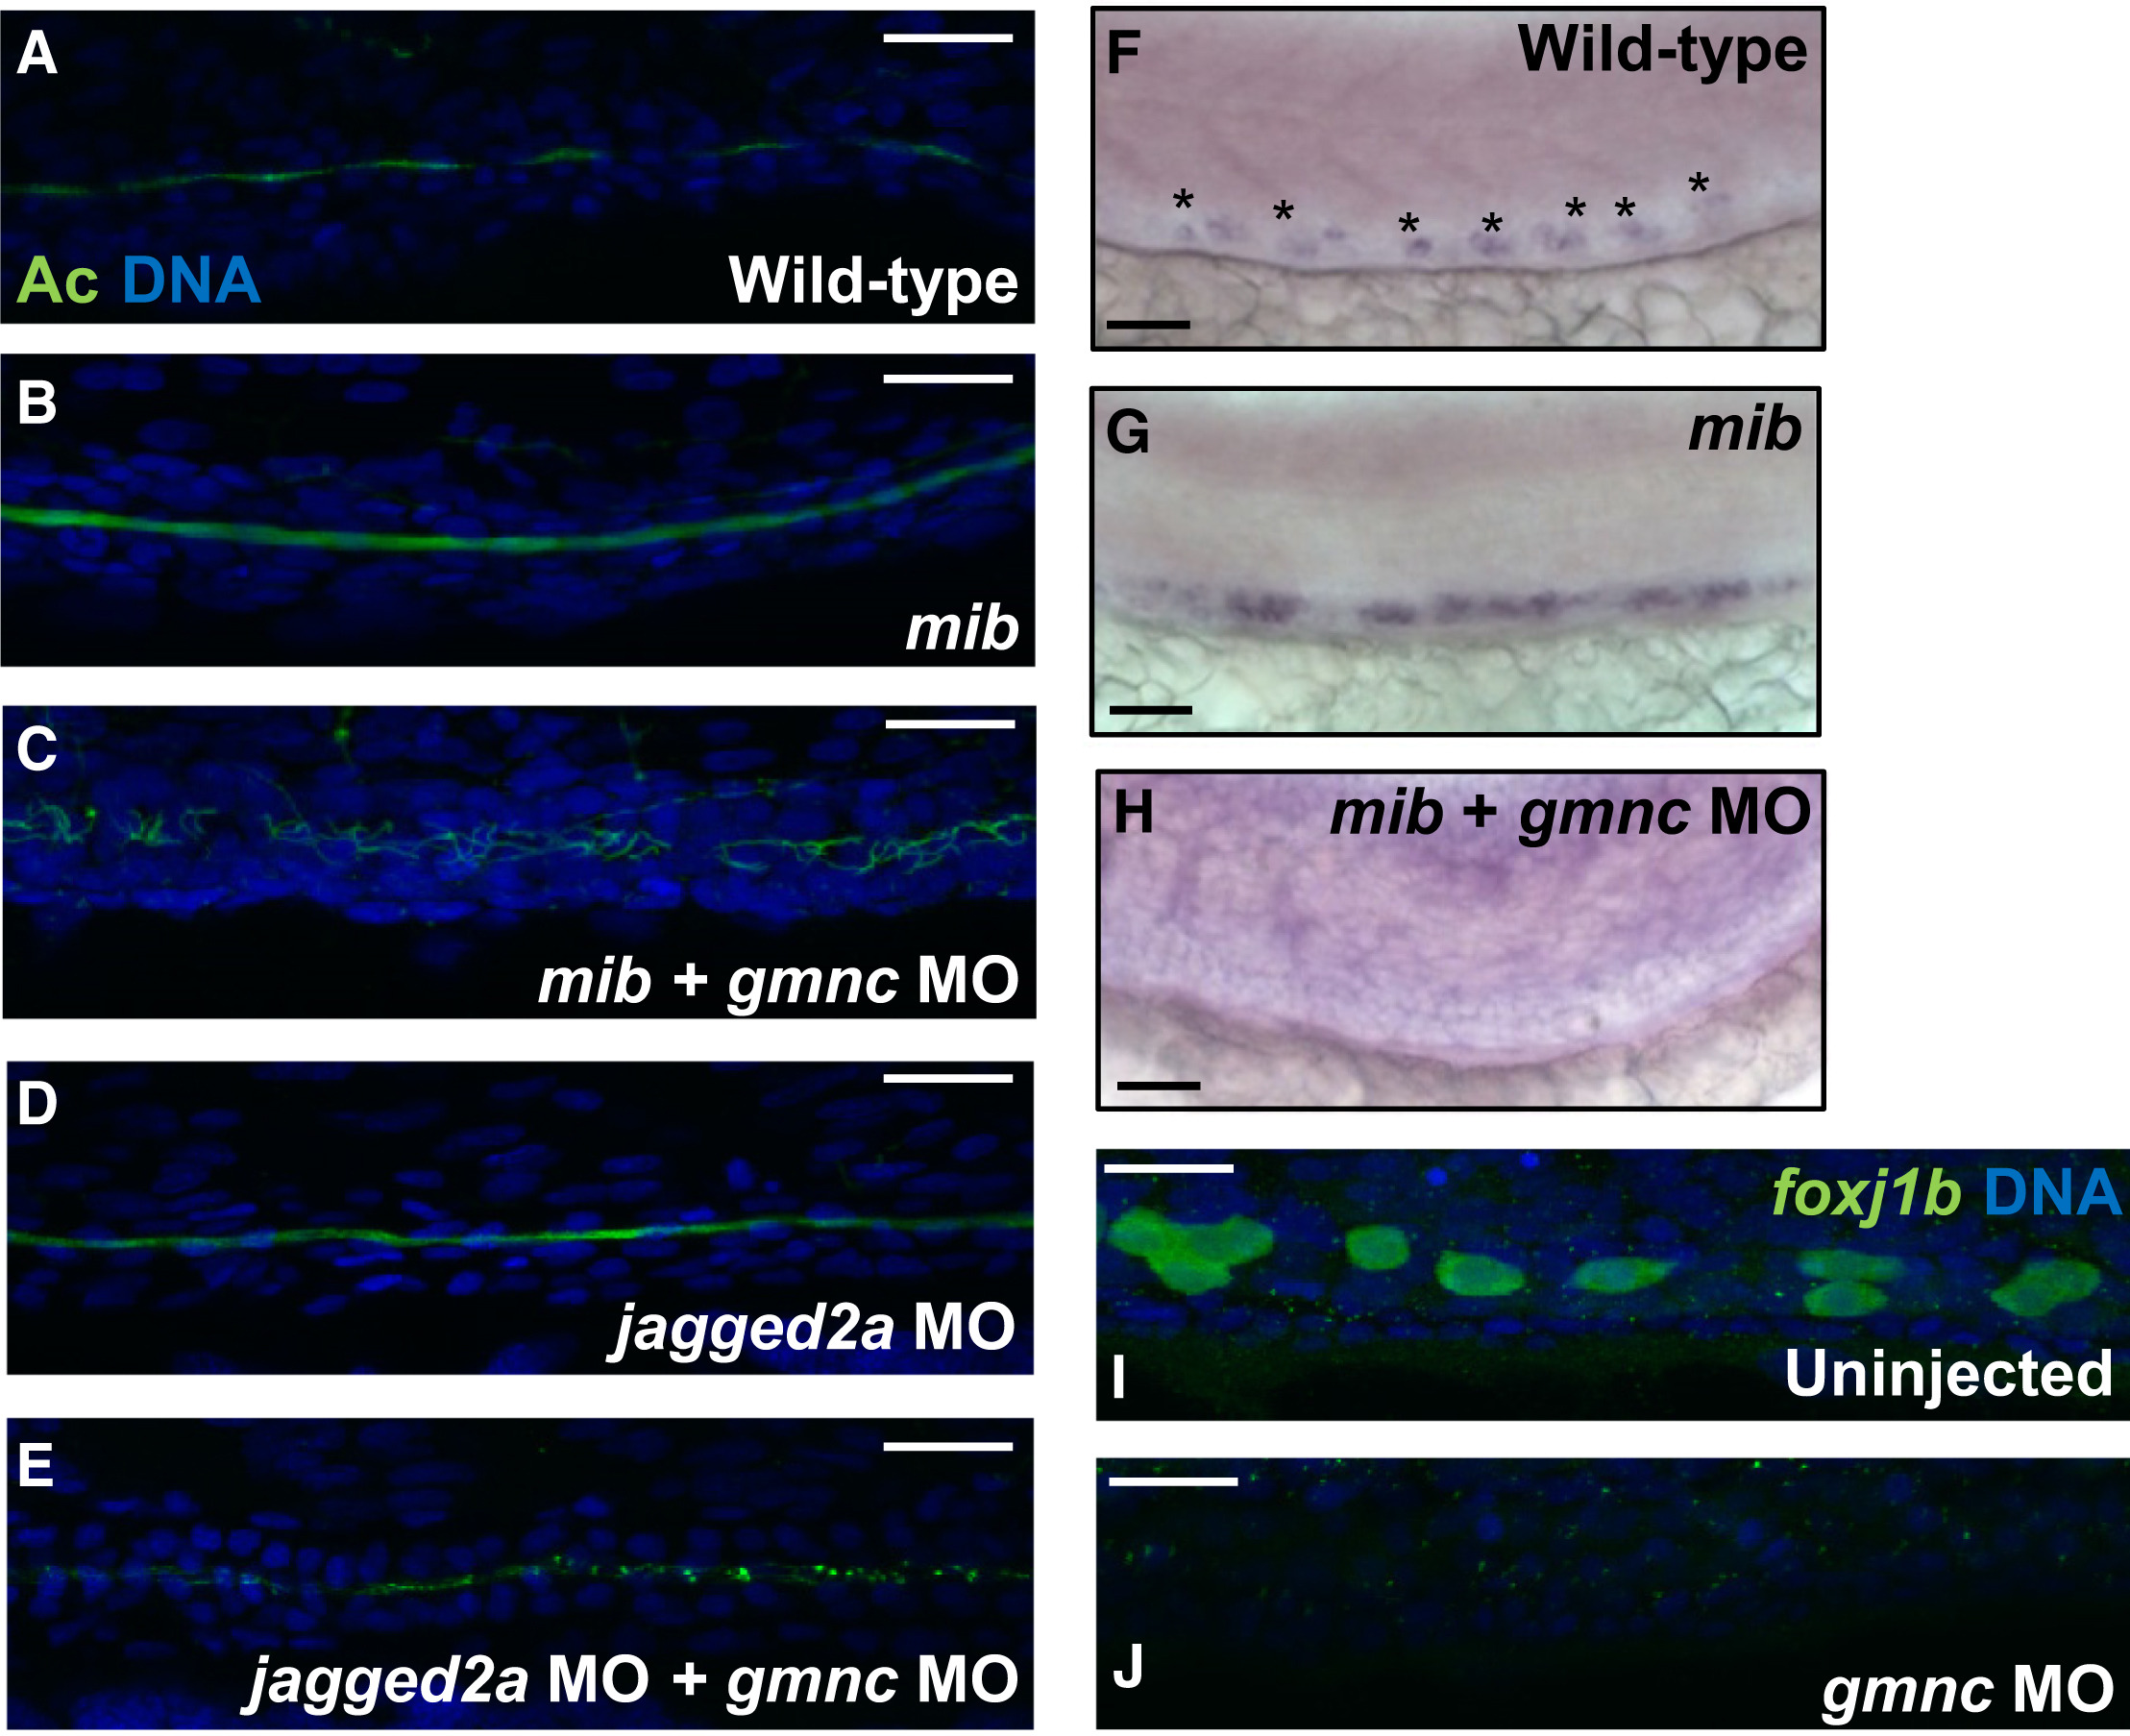
(A-C) At 48 hpf, the kidney tubules of mib mutant embryos display supernumerary MCCs, which appear as a contiguous bundle (B), in contrast to wild-type embryos, whose kidney tubules harbor distinct clusters of MCCs (A). A majority of the mib embryos injected with the gmnc MO were devoid of MCCs (75%; n = 10) (C), replicating the phenotype of the gmnc morphants ( Figure 1B). Acetylated-tubulin, green; DAPI, blue.
(D and E) Similar to the mib mutants (B), jagged2a morphants at 48 hpf harbor supernumerary MCCs lining the kidney tubules (D). Embryos co-injected with jagged2a and gmnc MOs exhibited the gmnc morphant phenotype and lacked MCCs (100%; n = 10) (E).
(F-H) At 24 hpf, the zebrafish mcidas gene is expressed in the kidney tubules in a spotted pattern (asterisks) that corresponds to the MCC precursors (F). mcidas expression domain is expanded in mib mutant embryos (G) and is completely lost when gmnc is knocked down in the mib background (100%; n = 20) (H).
(I and J) The Tg(foxj1b::GFP) reporter fish strain (T2BGSZ10) reveals that, at 24 hpf, foxj1b is expressed in the MCC precursor cells of the kidney ducts (I). foxj1b::GFP expression was lost in the gmnc MO-injected T2BGSZ10 embryos (100%; n = 16) (J). GFP (foxj1b), green; DAPI, blue.
Scale bars, 50 µm (F-H); 10 µm (all others). See also Figure S2.

