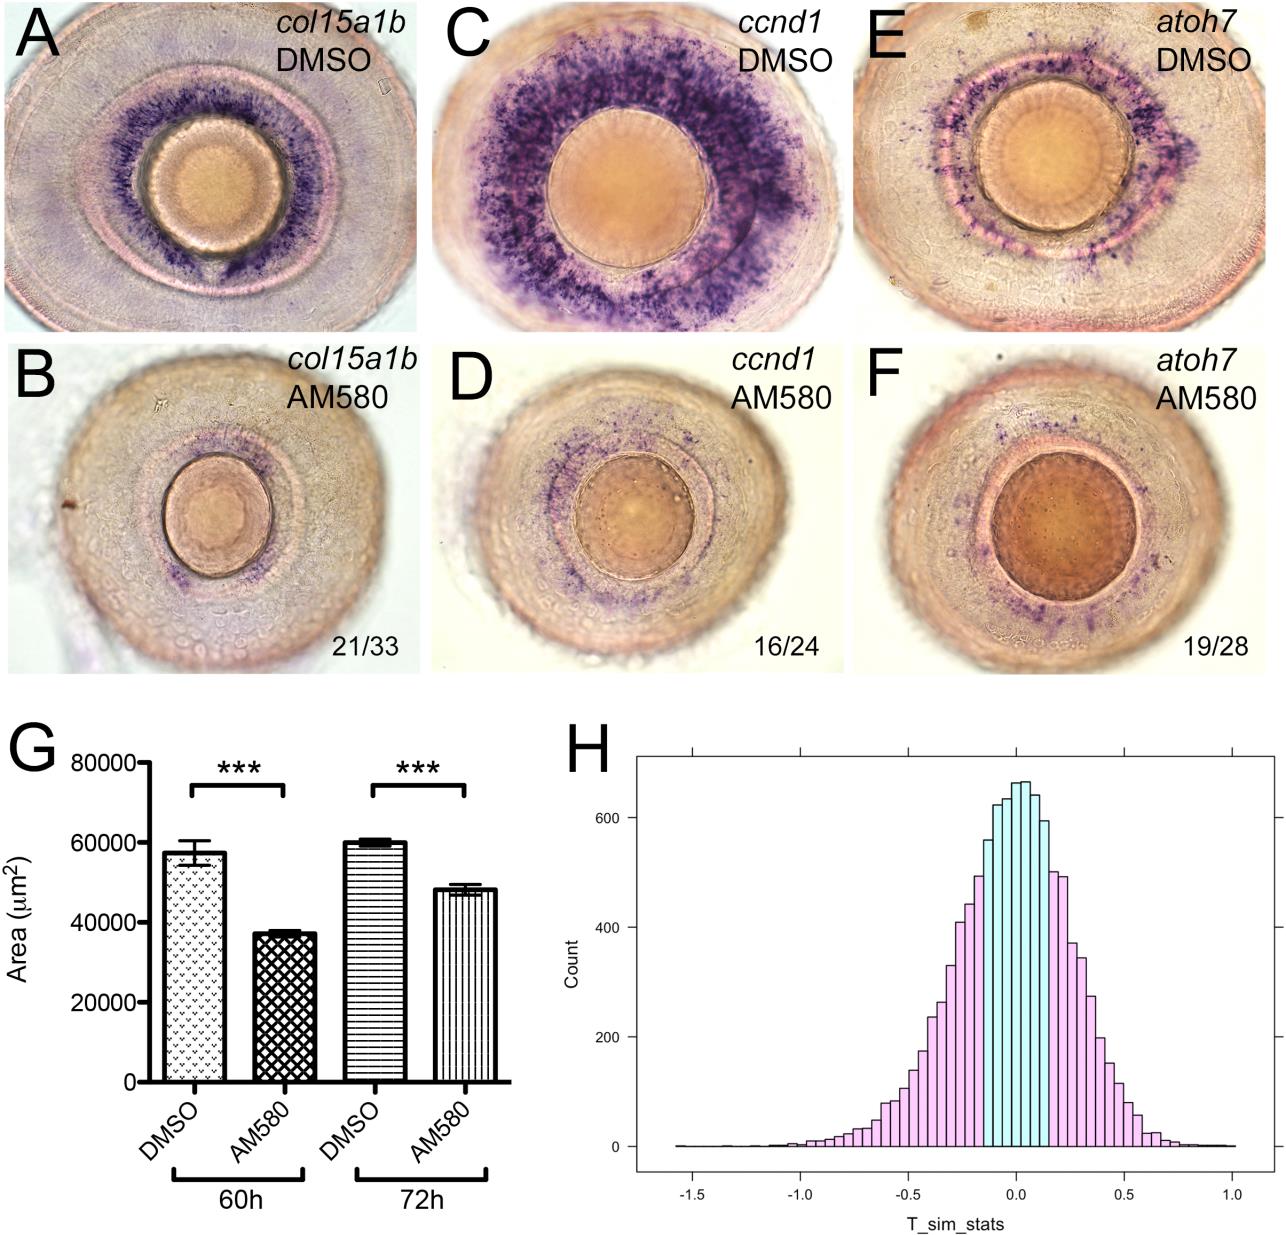
Fig. S4
AM580 treated fish phenocopy gdf6a mutants.
(A-F) Lateral views of eyes from wildtype embryos that were treated with 25 nM AM580 or an equal volume of vehicle control (DMSO) at 72 hpf for 12 hours and then assayed for expression of col15a1b (A-B), ccnd1 (C-D), and atoh7 (E-F) by in situ hybridization at 4.5 dpf. These representative images are similar to the phenotype observed when embryos were treated in the same way at 60 hpf and then assayed at 4.5 dpf. The numbers in the AM580-treated specimens show the number of embryos with the most severe phenotypes. The remaining embryos exhibited a noticeable, but more modest reduction in CMZ marker expression.
(G) Area measurements of eyes from wildtype embryos (n≥14 embryos for each condition) treated with 25 nM AM580 at either 60 hpf or 72 hpf for 12 hours and then fixed at 4.5 dpf were averaged and plotted with standard error bars (95% confidence limits; ***Student?s t-test, p≤ 0.000003).
(H) Statistical analyses of eye size in mutant and drug treated embryos. R-generated histogram for permutation testing of changes in eye size of gdf6a mutants (as compared to siblings) relative to AM580 treated wild-types (as compared to DMSO-treated siblings). Pink shading indicates the number of data points along the simulated distribution that are as extreme or more extreme than the T value (0.15664) divided by the total number of simulations, giving us a visual for the calculated p value (0.5468) and indicating that the ratios compared are not statistically significantly different.

