
|
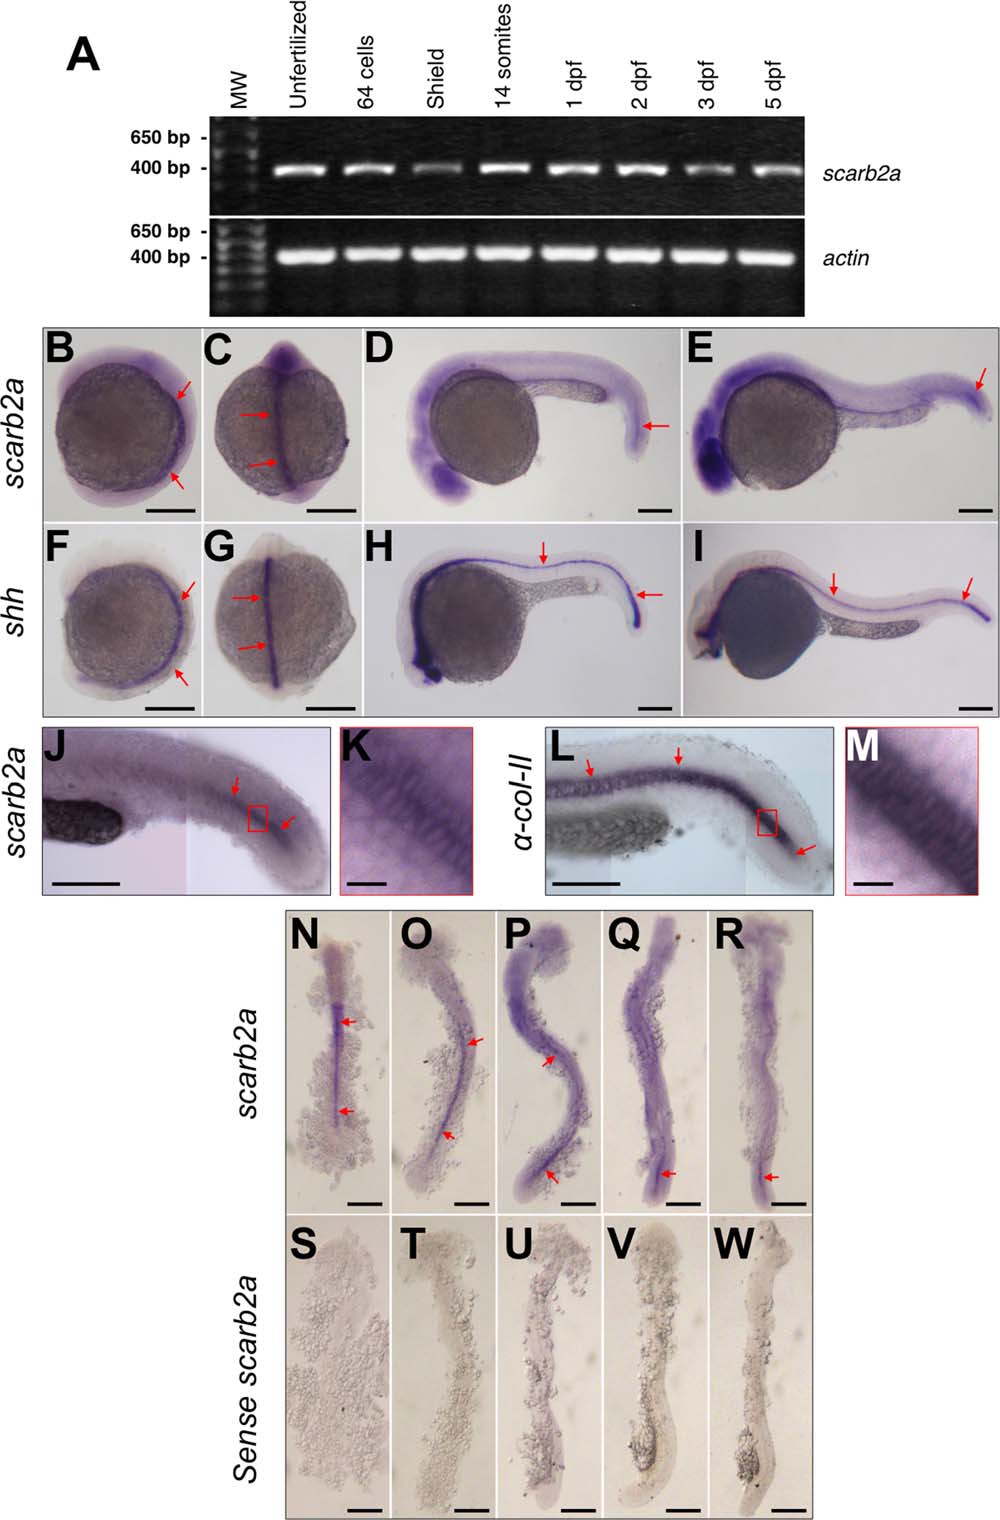
Fig. 2
scarb2a mRNA expression. A: scarb2a RT-PCR from cDNA prepared from unfertilized eggs and different developmental stages; 64 cells, shield, 14 somites, 1, 2, 3 and 5 dpf. Actin-beta1 was also amplified from the same samples as a positive control of expression. B-E: ISH expression, in WT embryos, of scarb2a at the 6 somite (side and dorsal view), 26 somite and prim-12 developmental stages (side views). F-I: For comparison, shh was also used for ISH labeling of the notochord at the same developmental stages. J-M: Side views of the posterior trunk comparing scarb2a and α-collagen-II expression in the notochord. K: Magnified view (20X) of the region indicated by the red box in (J). M: Magnified view (20×) of the red box in (L). Photographs in (J) and (K) are composite images. N-R: Embryos labeled by scarb2a ISH and then flat mounted for detailed observation of notochord expression at the 10 somite, 14 somite, 18 somite, 21 somite and 24 hpf developmental stages. S-W: As a control, ISH was performed with the scarb2a sense probe at the same developmental stages. Red arrows indicate expression of the tested probes in the notochord. Scale bars = 250 µm, except those in panels K and M, which represent 25 µm in length.