
|
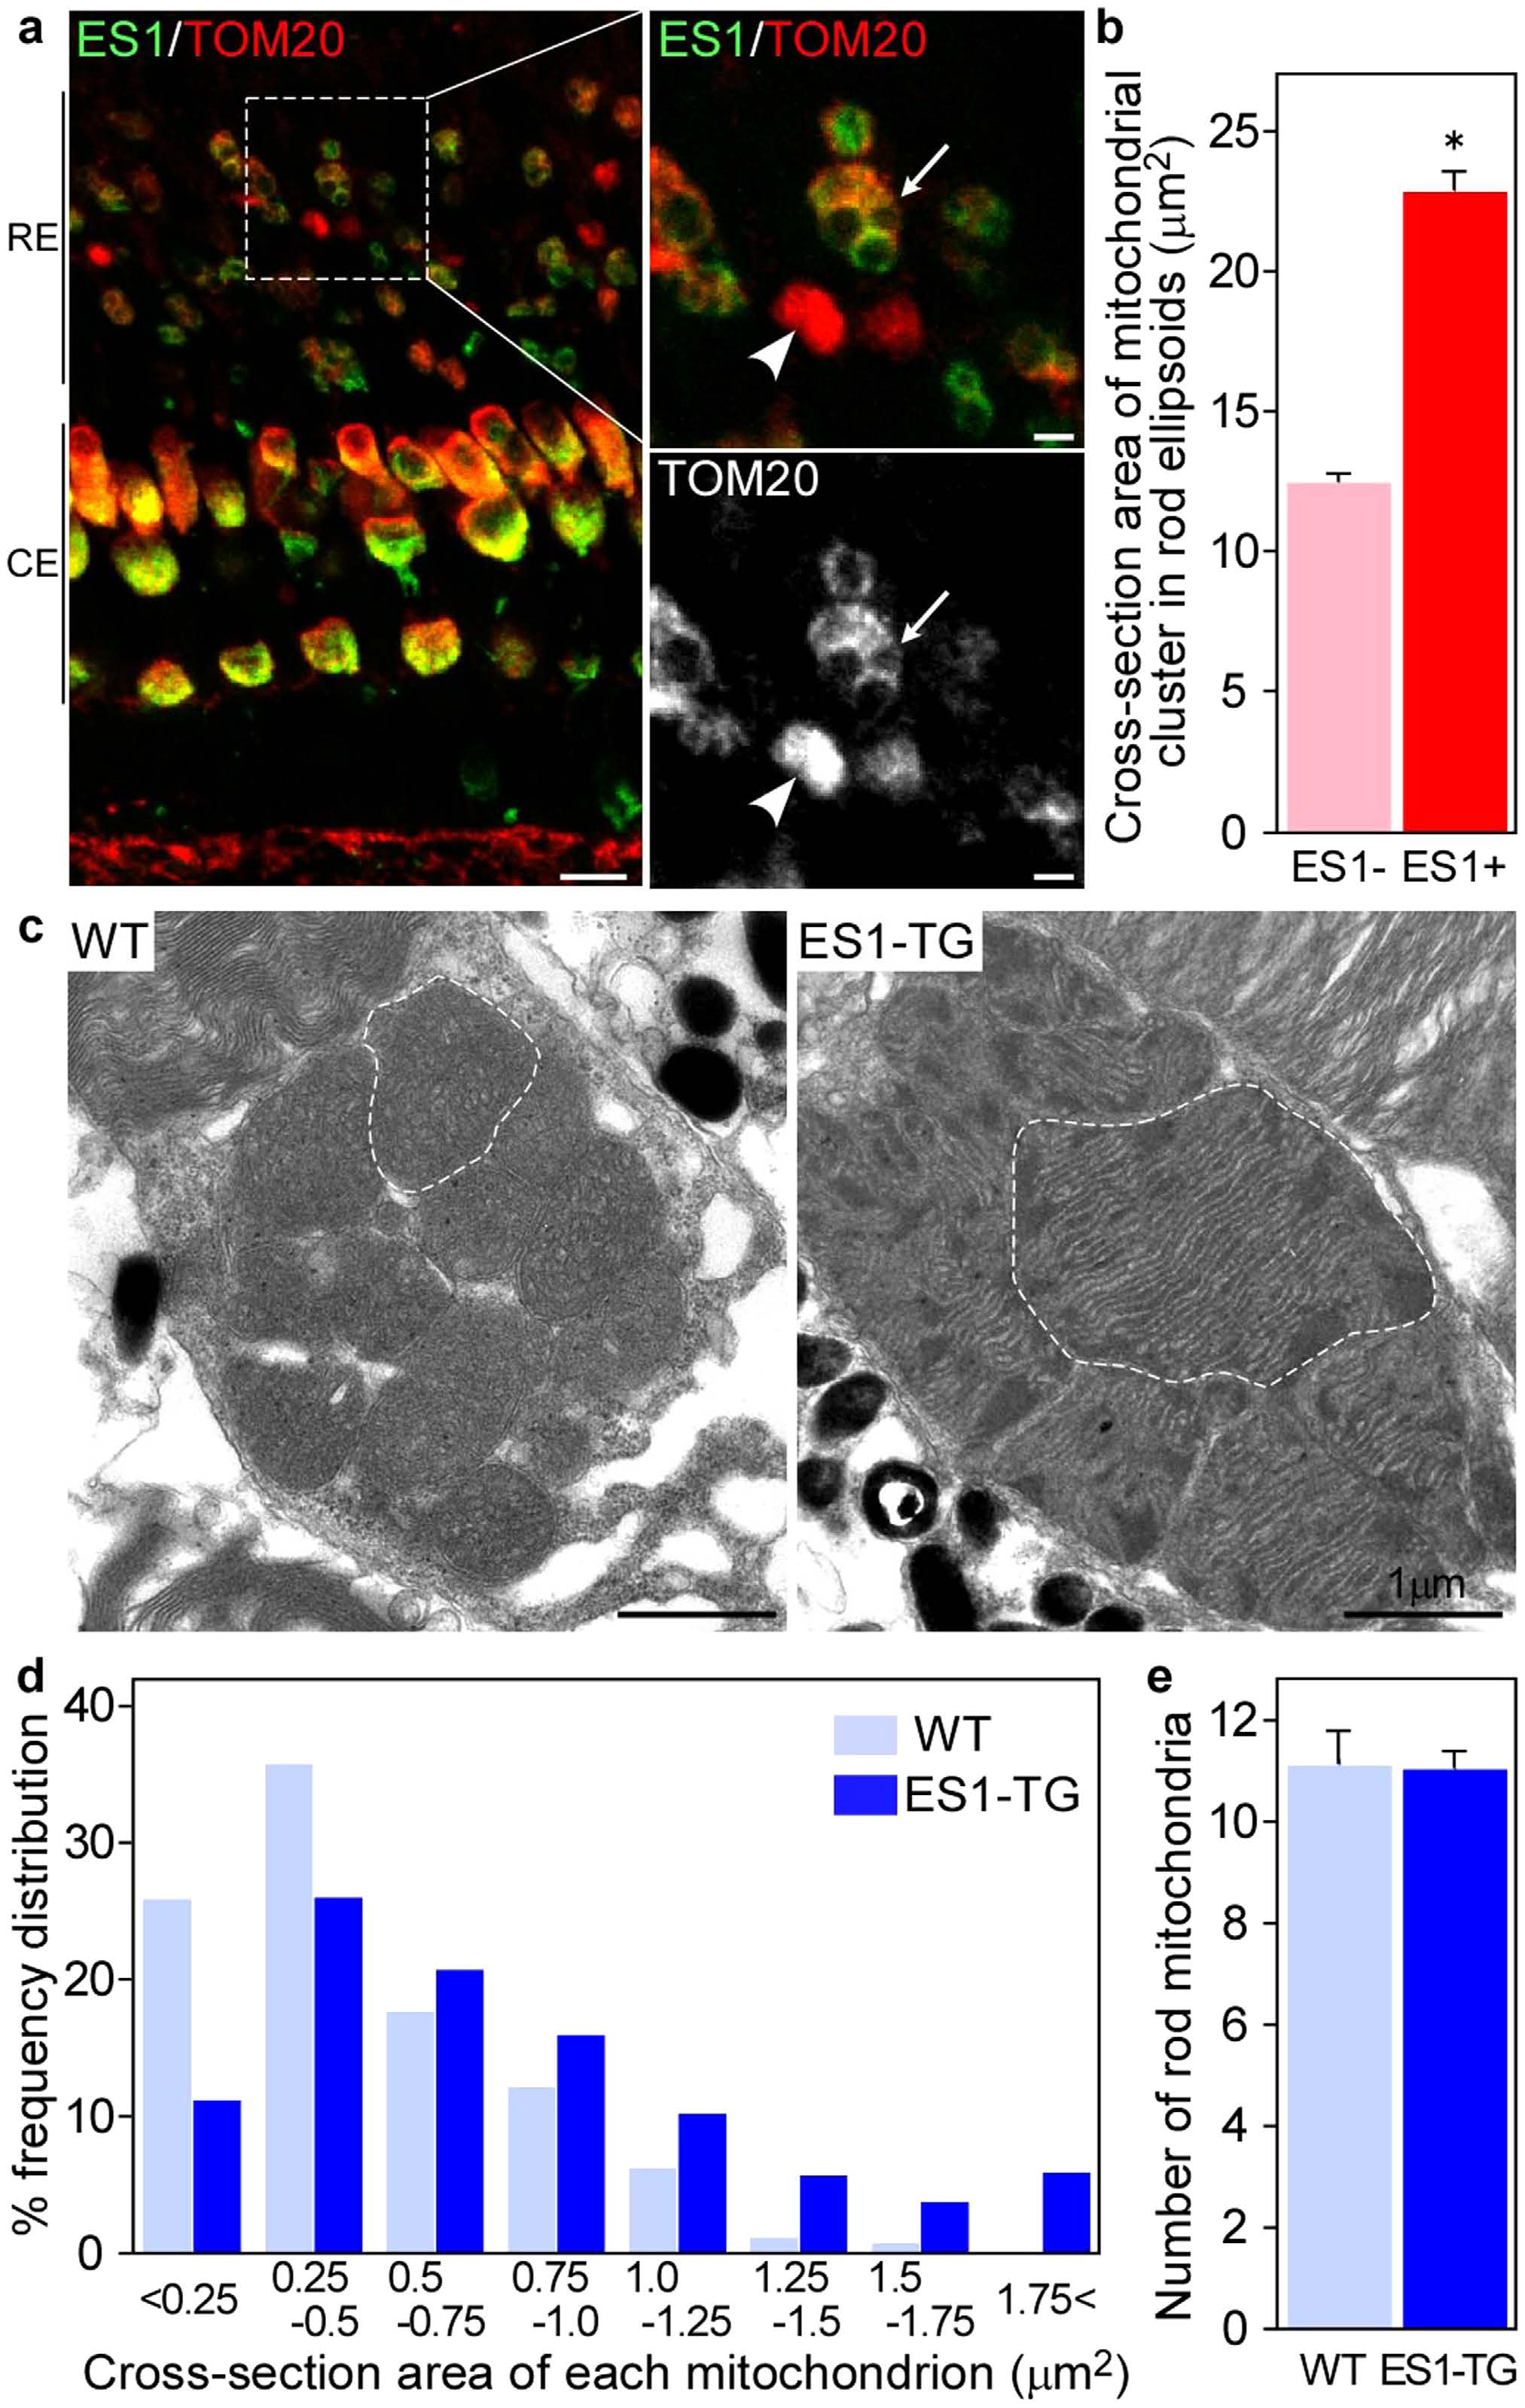
Fig. 3
Ectopic expression of ES1 led mitochondrial enlargement in rods.(a) Immunohistochemistry of retinal sections from adult ES1-TG zebrafish (F0) with ES1 (green) and TOM20 (red) antibodies. Images are at a certain depth of confocal view. Right panels show a magnified view of merged image (upper) or TOM20 alone (lower). An arrow in each panel indicates a mitochondrial cluster in an ES1-expressing rod ellipsoid and an arrowhead indicates a mitochondrial cluster in a wild-type rod ellipsoid. As in the cone ellipsoids, immunopositive signals were weaker in the round patch in the ES1-expressing rods than the wild-type, presumably because of low antibody permeability of mega-mitochondria. Scale bars, 10 µm (left panel) and 2 µm (right panels). RE: rod ellipsoid, CE: cone ellipsoid. (b) Quantification of cross-section areas of mitochondrial clusters in rod ellipsoids. TOM20-immunopositive cross-section areas including immunonegative round areas were measured. Values are means ± S.E., *P = 2 × 1031 in Student’s t-test, n = 120 for wild-type rods (ES1-) and n = 142 for ES1-expressing rods (ES1+). (c) Representatives of electron microscopic images of mitochondria in wild-type (WT) rods (left panel) or ES1-TG rods (right panel). F1 generation of ES1-TG zebrafish, in which all rods express ES1, was used. Dashed lines outline the largest mitochondrion in each view. (d) Mitochondrial size distribution in ES1-TG and WT rods. Cross-section area of each mitochondrion was measured in the electron microscopic images. n = 256 for WT and n = 420 for ES1-TG. (e) The number of mitochondria present in each rod. Values are means ± S.E., n = 23 for WT and n = 38 for ES1-TG.