
|
Fig. S7
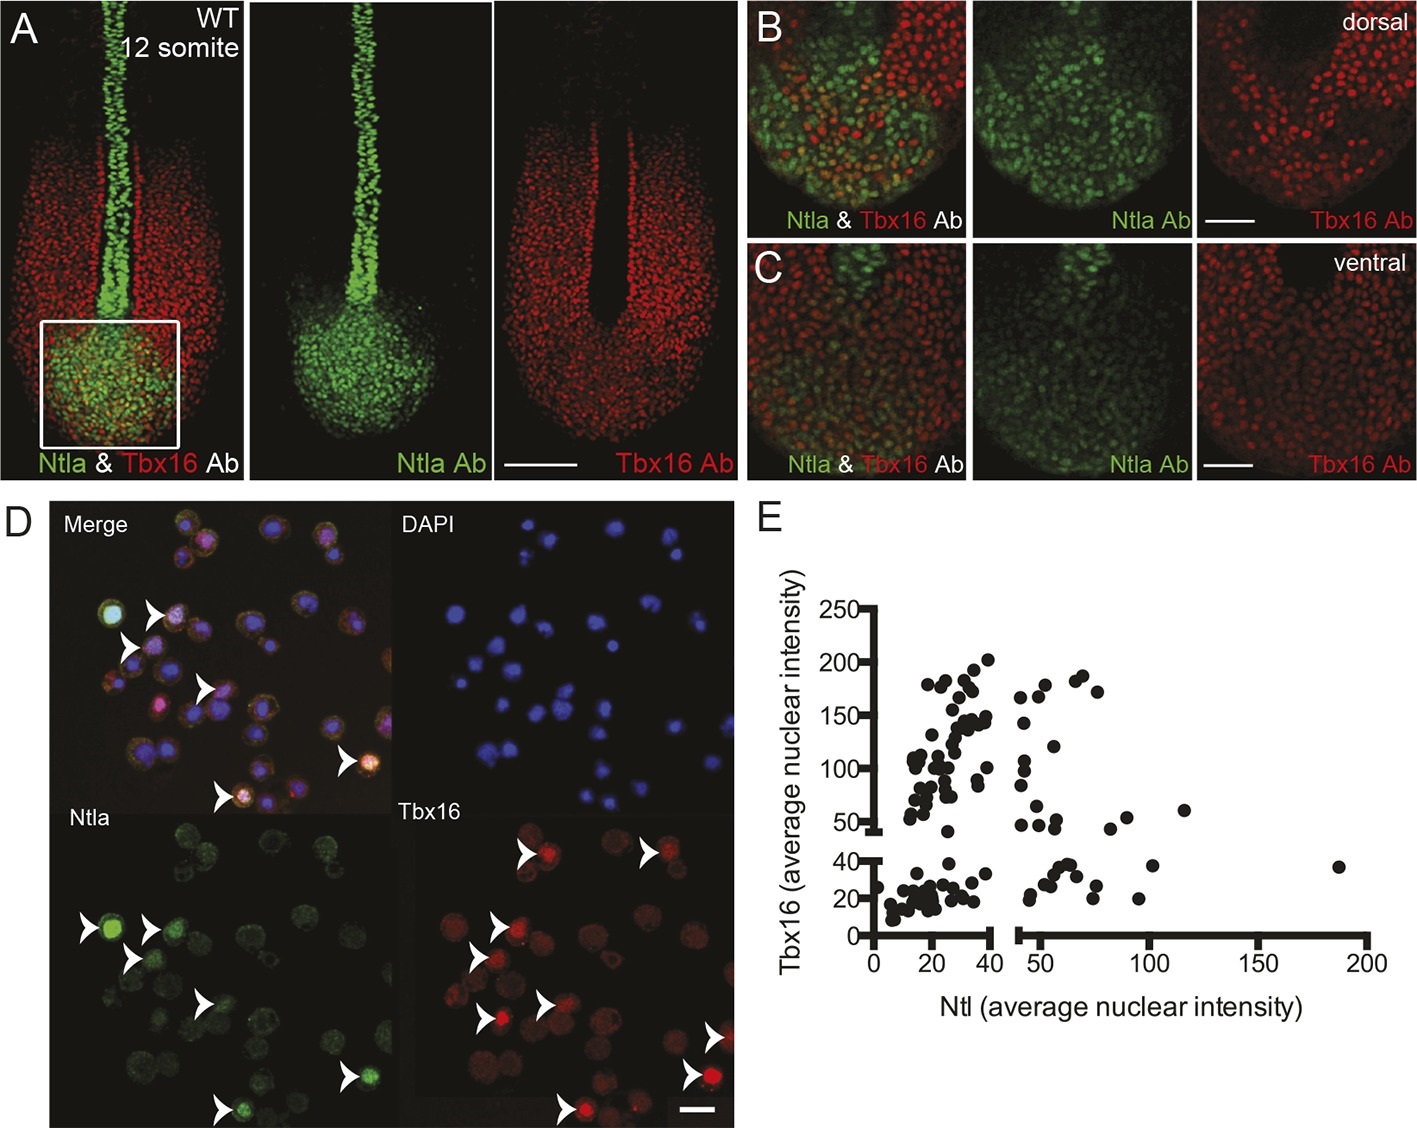
Expression of tailbud markers in vivo and in low-density cultures of segmentation clock cells.(A) z-stack projection showing the expression patterns of Ntla (green) and Tbx16 (red) protein in a 12-somite stage wild type embryo detected using immunohistochemistry with monoclonal antibodies D18-4 (IgG1) to Ntla and C24-1 (IgG2a) to Tbx16. Scale bar = 120 �m (B-C) Close up view of the boxed area in (A) showing a single confocal section at dorsal (B) and ventral (C) locations in the tailbud. Scale bar = 60 �m. (D) Representative panels showing expression of Ntla (green) and Tbx16 (red) in single cells within low-density tailbud cultures (serum + Fgf8b) after 5 hr in vitro. Nuclei are labeled with DAPI (blue). Cells single-positive for Ntla and Tbx16 are visible, as are cells co-expressing both proteins. Scale bar = 20 �m. (E) Quantification of nuclear fluorescence intensity of experiment in (D) showing populations of Ntla-positive, Tbx16-positive, and Ntla/Tbx16 co-expressing cells.