
|
Fig. 6
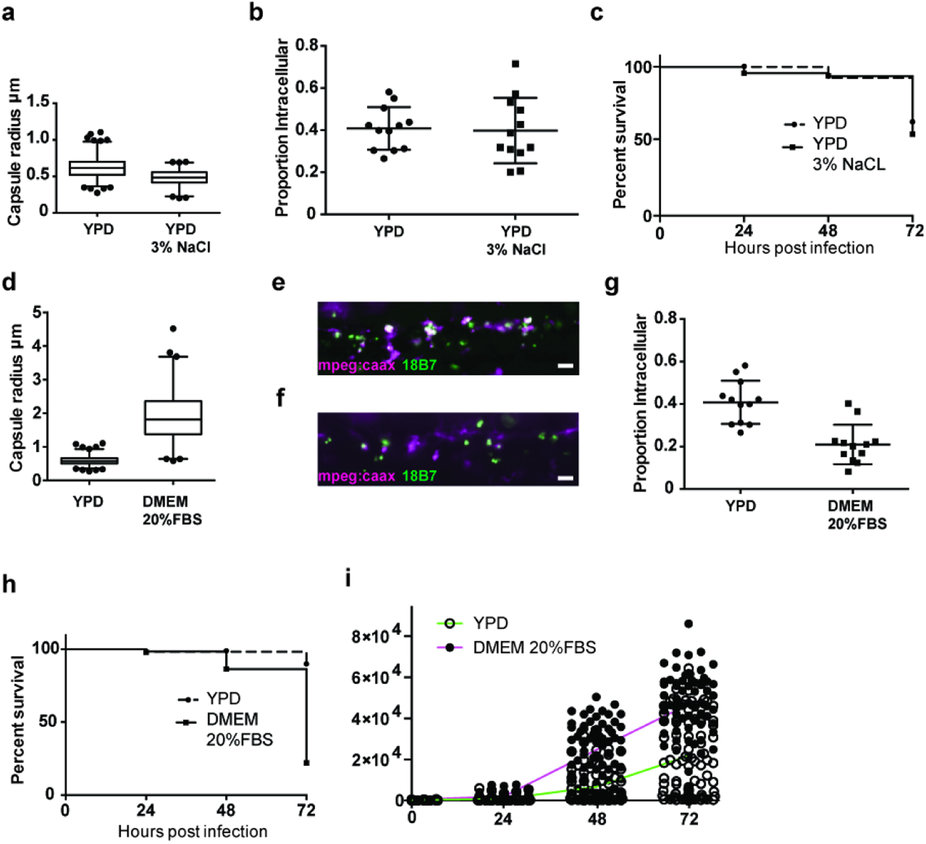
In vitro recapitulation of large polysaccharide capsule prevents macrophage phagocytosis in vivo.(a) Reduction of cryptococcal capsule in vitro. P < 0.001, Mann-Whitney; Medians YPD = 0.62 �m, YPD 3%NaCl = 0.48 �m. 632 (YPD) and 345 (YPD 3% NaCl) infections, India ink staining from n = 3. (b) Proportion of intracellular cryptococci 2 hpi of Tg(mpeg1:mCherryCAAX)sh378 with >101-102 C. neoformans strain H99GFP grown in YPD or YPD 3% NaCl. Each point represents a separate infection from n = 4 plotted with median and standard deviation. (c) Survival of AB-strain zebrafish infected with >102-103 of C. neoformans strain H99GFP grown in YPD or YPD 3% NaCl (P = 0.38, logrank (Mantel-Cox)). 55 (YPD) and 66 (YPD 3% NaCl) infections, from n = 3. (d) Induction of cryptococcal capsule in vitro. P < 0.001, Mann-Whitney, Medians YPD = 0.58 �m, DMEM 20% FBS = 1.81 �m. 513 (YPD) and 255 (DMEM 20% FBS) India ink staining from n = 3. (e,f) Example maximum intensity projection from three-dimensional fluorescence imaging of Tg(fms:Gal4.VP16)i186;Tg(UAS:nfsB.mCherry)i149 (magenta) infected with >101-102 of C. neoformans strain H99GFP (green) 2 hpi. Intracellular yeast appear white due co-localisation of both colours (e) YPD inoculum. (f) DMEM 20% FBS inoculum. (g) Proportion of intracellular cryptococci 2 hpi of Tg(mpeg1:mCherryCAAX)sh378 with >101-102 C. neoformans strain H99GFP grown in YPD or DMEM 20% FBS. Each point represents a separate infection from n = 4 with median and standard deviation. (h) Survival of AB-strain zebrafish infected with >101-102 of C. neoformans strain H99GFP grown in YPD or DMEM 20% FBS. P < 0.0001, logrank (Mantel-Cox). hazard ratio = 8.2 (logrank; 95% confidence interval 6.5, 20.0). 57 and 59 infections from YPD and DMEM 20% FBS groups respectively, from n = 3. (i) Linear comparison of quantification of fungal burden using area of fluorescent pixels from Nacre-strain zebrafish infected with between >101-102 of C. neoformans strain H99GFP grown in YPD or DMEM 20% FBS. Individual infection and mean fungal burden values with H99GFP grown in YPD (open circles and green line respectively) or H99GFP grown in DMEM 20% FBS (filled circles and magenta line respectively) treatment. Each point is a separate infection; the same 100 (YPD) or 97 (DMEM 20% FBS) infections followed over 72 hours from n = 3. Box plots are whiskers at 5 and 95 percentiles with outliers plotted.