Fig. 3
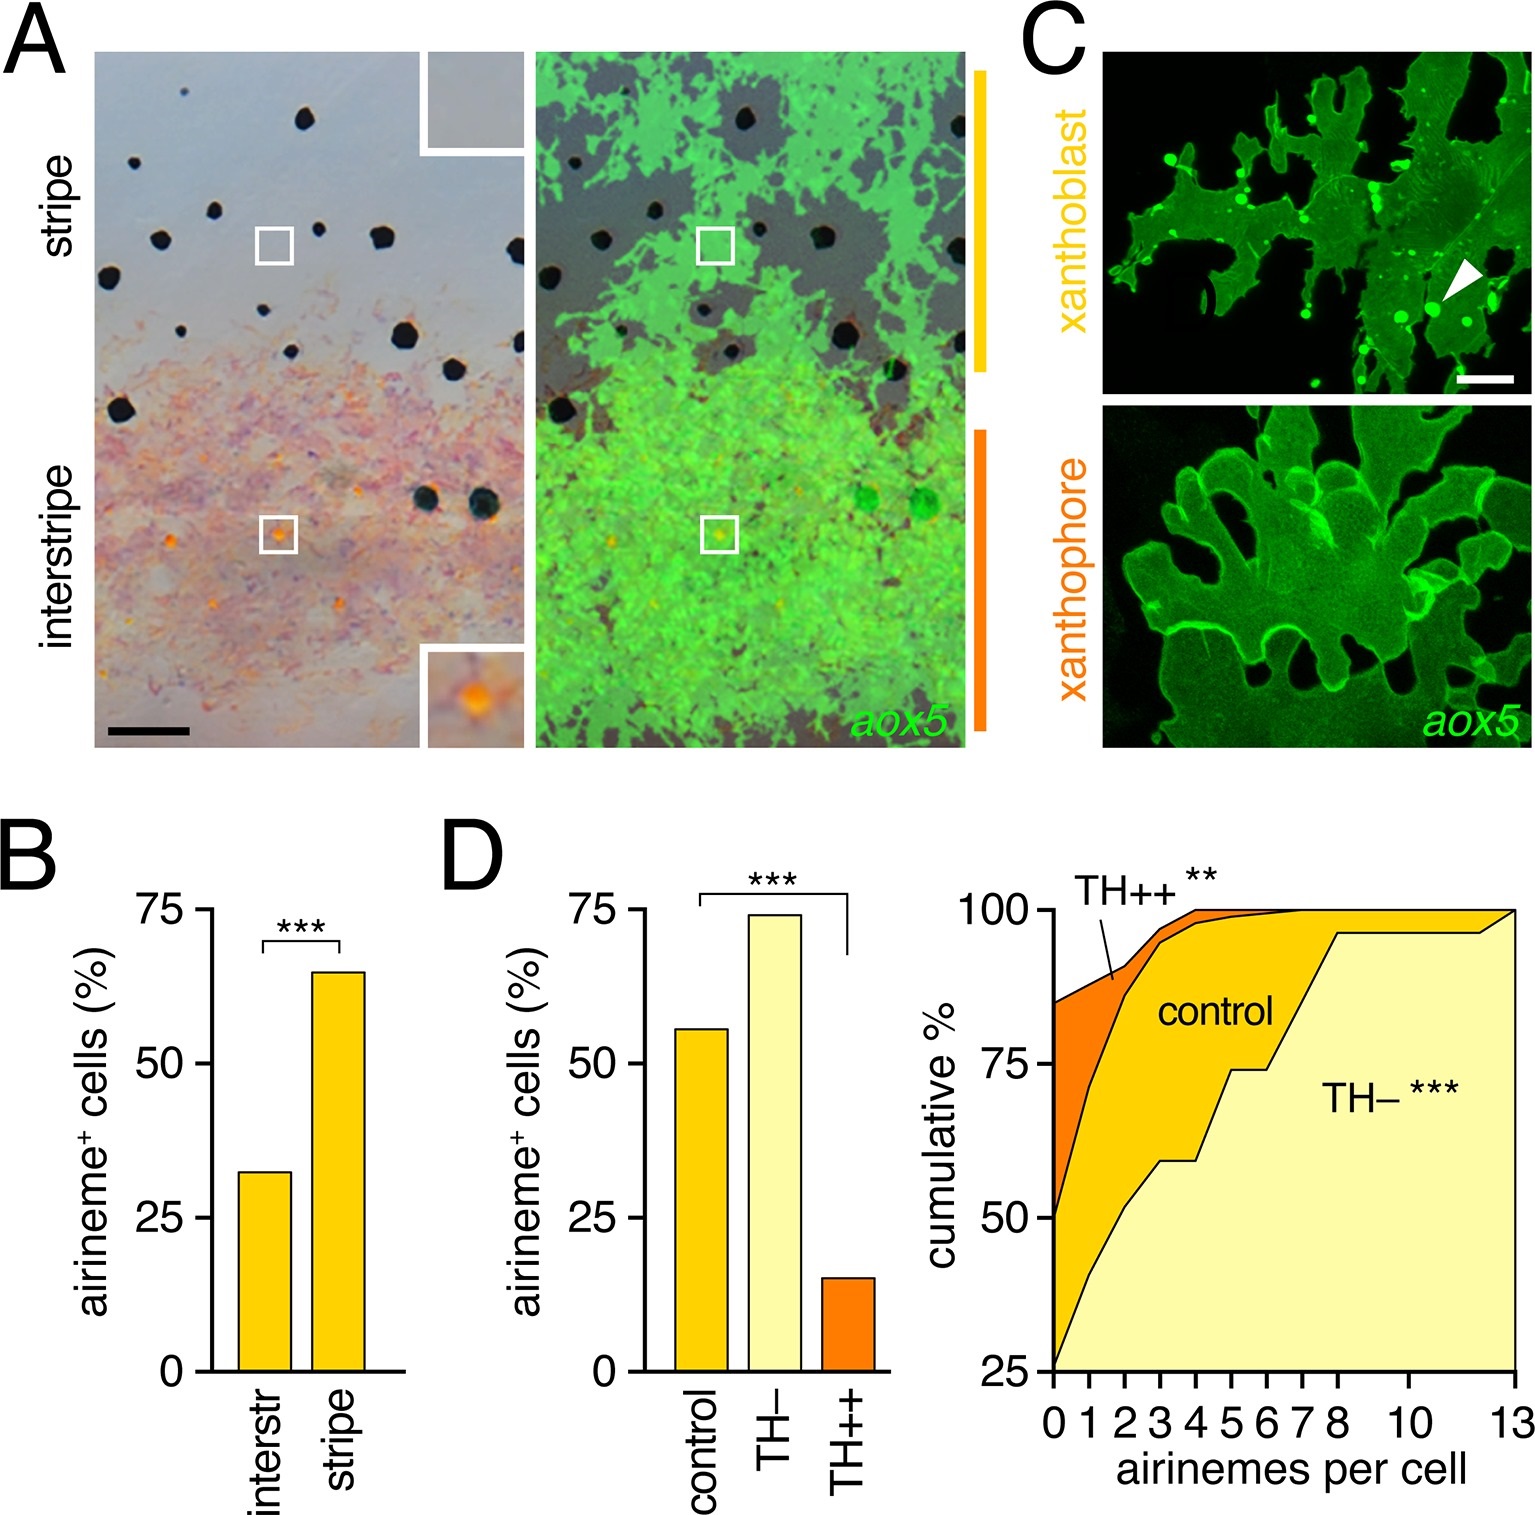
Airinemes were produced by xanthoblasts within prospective stripe regions.(A) Detail of developing pattern in zebrafish, illustrating pigmented aox5+ xanthophores of the interstripe as well as unpigmented aox5+ xanthoblasts of the prospective stripe (insets, boxed regions shown at higher magnification). Larva shown is 8.6 SSL, when xanthophore pigment is more readily visible, but after the peak of airineme production (Figure 1C). (B) aox5+ cells in prospective stripe regions were more likely to extend airinemes than aox5+ cells of the interstripe (χ2=28.6, d.f.=1, p<0.0001, N=295 cells). (C) Xanthoblasts (upper) had numerous membrane blebs (arrowhead), whereas xanthophores (lower) had smooth surfaces and more lobular edges (7.8 SSL). (D) Forced differentiation (TH++) reduced the incidence of cells that extended airinemes (left; χ2=12.2, d.f.=1, p<0.0001, N=123 cells) and the numbers of airinemes extended by each cell (right; TH++; χ2=12.0, d.f.=1, p<0.05), whereas differentiation-arrest increased airineme production (TH?; χ2=29.6, d.f.=1, p<0.0001; 7.5 SSL) Scale bars: 50 Ám (A); 10 Ám (C).

