
|
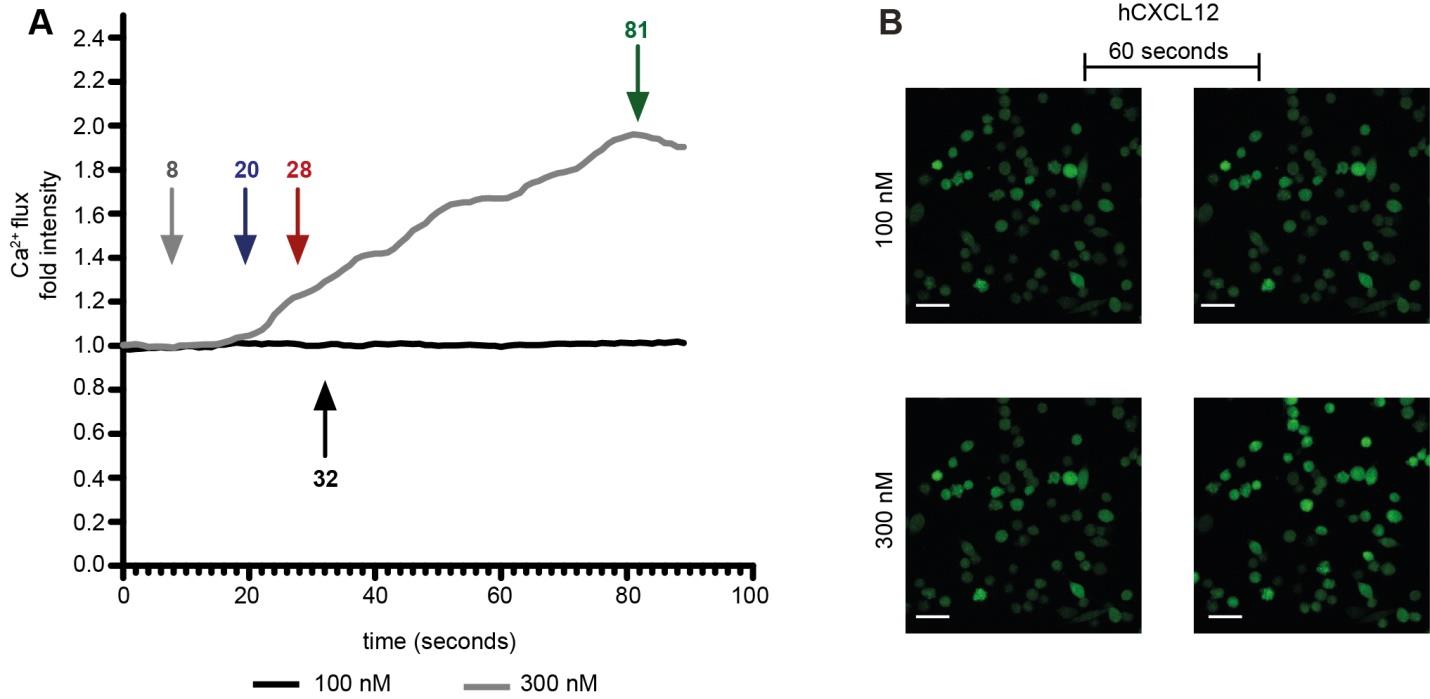
Fig. S1
Ca2+ efflux in the parental line MDA-MB-231. Ca2+ mobilization was assessed upon stimulation with 100 and 300 nM hCXCL12. (A) After addition (32nd second, black arrow) of 100 nM hCXCL12, no response was detected in MDA-MB-231. The same sample was subjected to stimulation with higher concentration (300 nM). In this case, the chemokine addition (8th second, grey arrow) resulted in an initiation of response (20th second, blue arrow), with the highest signal intensity registered 1 minute later (81st second, green arrow). The red arrow indicates the expected time of highest signal intensity (8 seconds after signal initiation), which was observed upon stimulation of MDA-MB-231-B with 100 nM hCXCL12 (Figure 2D). (B) Signal intensity at ligand addition and 60 seconds after stimulation. No difference in signal intensity was observed with 100 nM hCXCL12, while fluorescence increase was registered with 300 nM hCXCL12. Scale bar: 50 µm.