
|
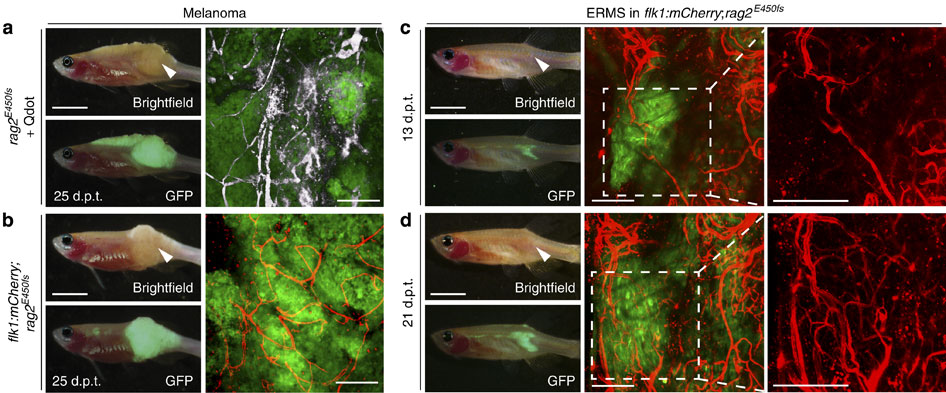
Fig. 2
Imaging neovascularization in rag2E450fs (casper) zebrafish engrafted with fluorescently labelled melanoma and ERMS.
(a) GFP-labelled, amelanotic melanoma implanted into rag2E450fs (casper) fish (n=8 animals) and imaged following intravascular injection of crimson quantum dots (Qtracker 655). Whole animal images to the left and confocal images to the right ( � 100 magnification, 100-200 �m z-stack). Quantum dot fluorescence has been pseudo-coloured white. (b) GFP-labelled, amelanotic melanoma implanted into flk1:mCherry; rag2E450fs (casper) transgenic zebrafish (n=4 animals). (c-d) GFP-labelled ERMS engrafted into flk1:mCherry; rag2E450fs (casper) transgenic zebrafish (n=5 animals) and serially imaged over time (c, 13 d.p.t. and d, 21 d.p.t.). White arrowheads denote the site of intra-muscular injection of tumour cells. Scale bars equal 5 mm in whole animal images and 200 �m in confocal images.