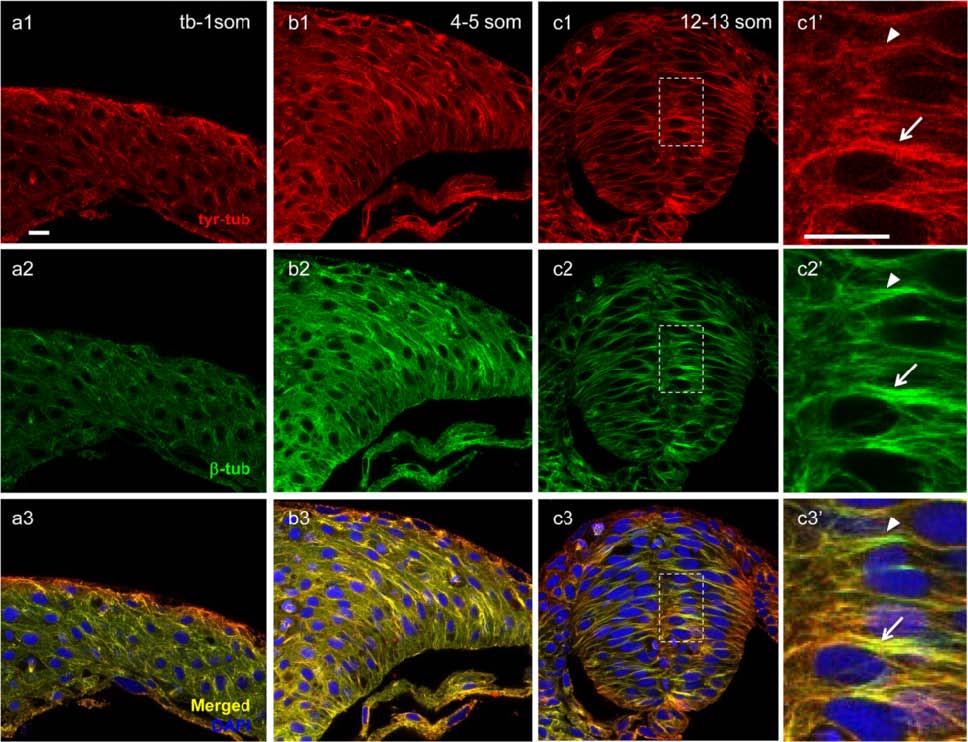
Fig. 2
Distribution of dynamic microtubules during neurulation. Hindbrain sections of embryos at the neural plate (tb-1 som) (a1?a3), neural keel (4?5 som) (b1?b3) and neural rod (12?13 som) (c1?c3′) stages immunolabeled with anti-tyr-tub (dynamic MTs) in red (a1, b1, c1, c1′), anti-β-tub (total MTs) in green (a2, b2, c2, c2′). (a3, b3, c3, c3′) Red-Green overlay (yellow) of images in (a1-c2′) with nuclei labeled in blue using DAPI. (c1′-c3′) Higher magnification of boxed areas in (c1?c3). Arrows indicate high overlap between anti-tyr-tub and anti-β-tub; arrowheads indicate area of reduced overlap between these two markers. Scale bars: 10 Ám

