Image
Figure Caption
Fig. 4
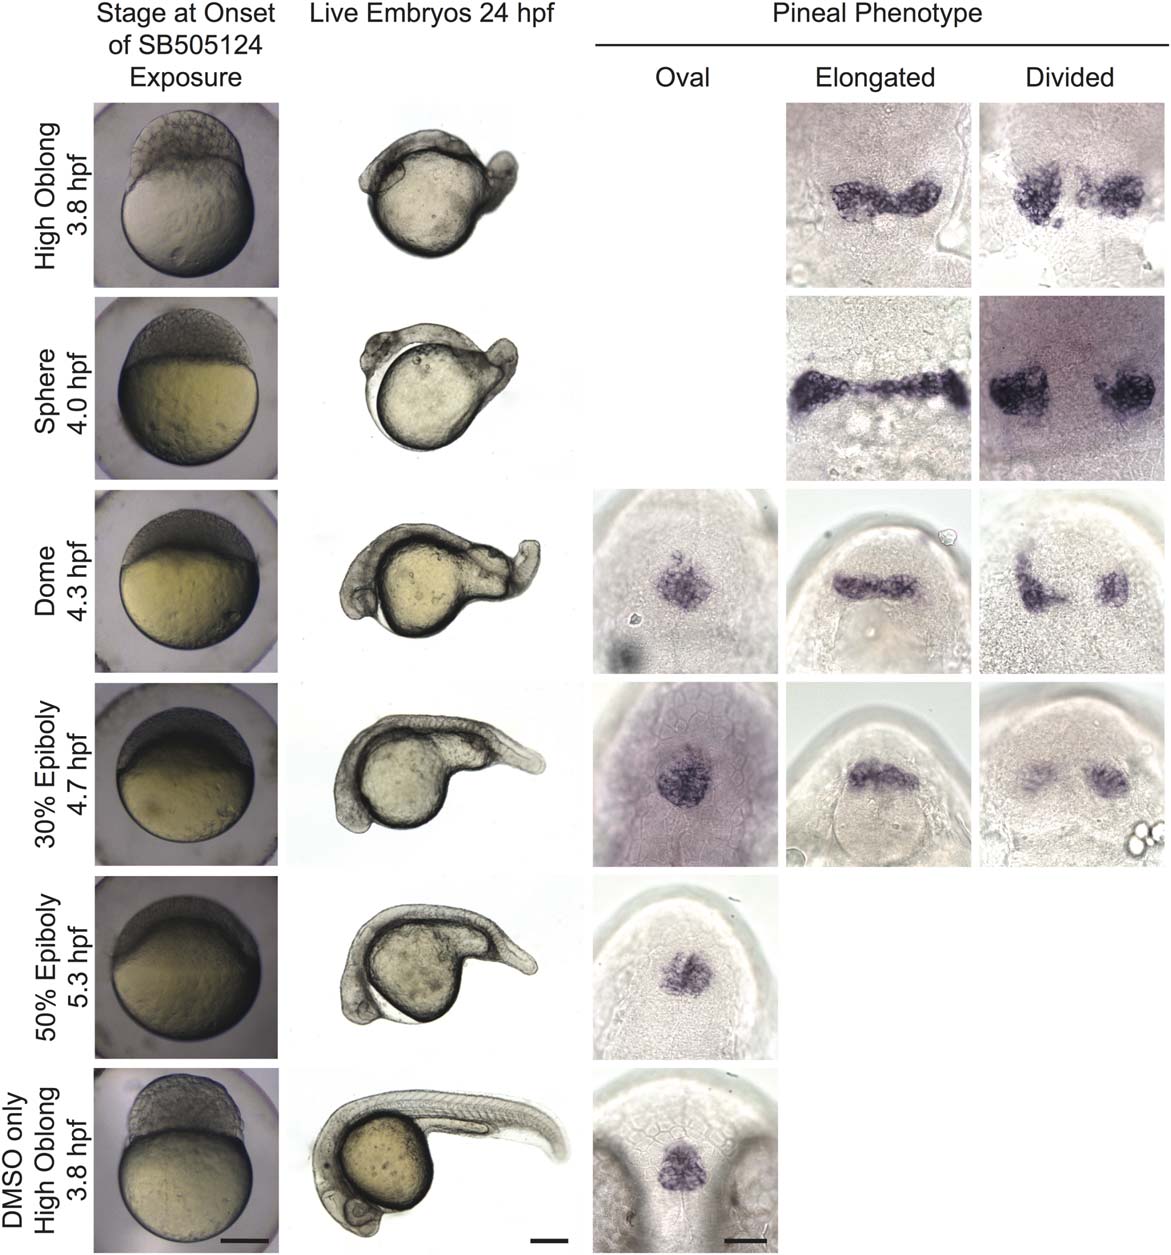
Initiating SB505124 treatment during mid blastula stages blocks neural tube closure. First column: developmental stage and images of live embryos at the onset of inhibitor exposure. Lateral views with animal pole to the top. Scale bar: 250 Ám. Second column: lateral views of whole embryos with anterior to the left and dorsal to the top. Scale bar: 250 Ám. Third?fifth column: Embryos were assayed for otx5 expression in the pineal gland. Dorsal views, anterior to the top. Scale bar: 50 Ám. Refer to Table 3 for quantitative data.
Figure Data
Acknowledgments
This image is the copyrighted work of the attributed author or publisher, and
ZFIN has permission only to display this image to its users.
Additional permissions should be obtained from the applicable author or publisher of the image.
Full text @ Genesis

