
|
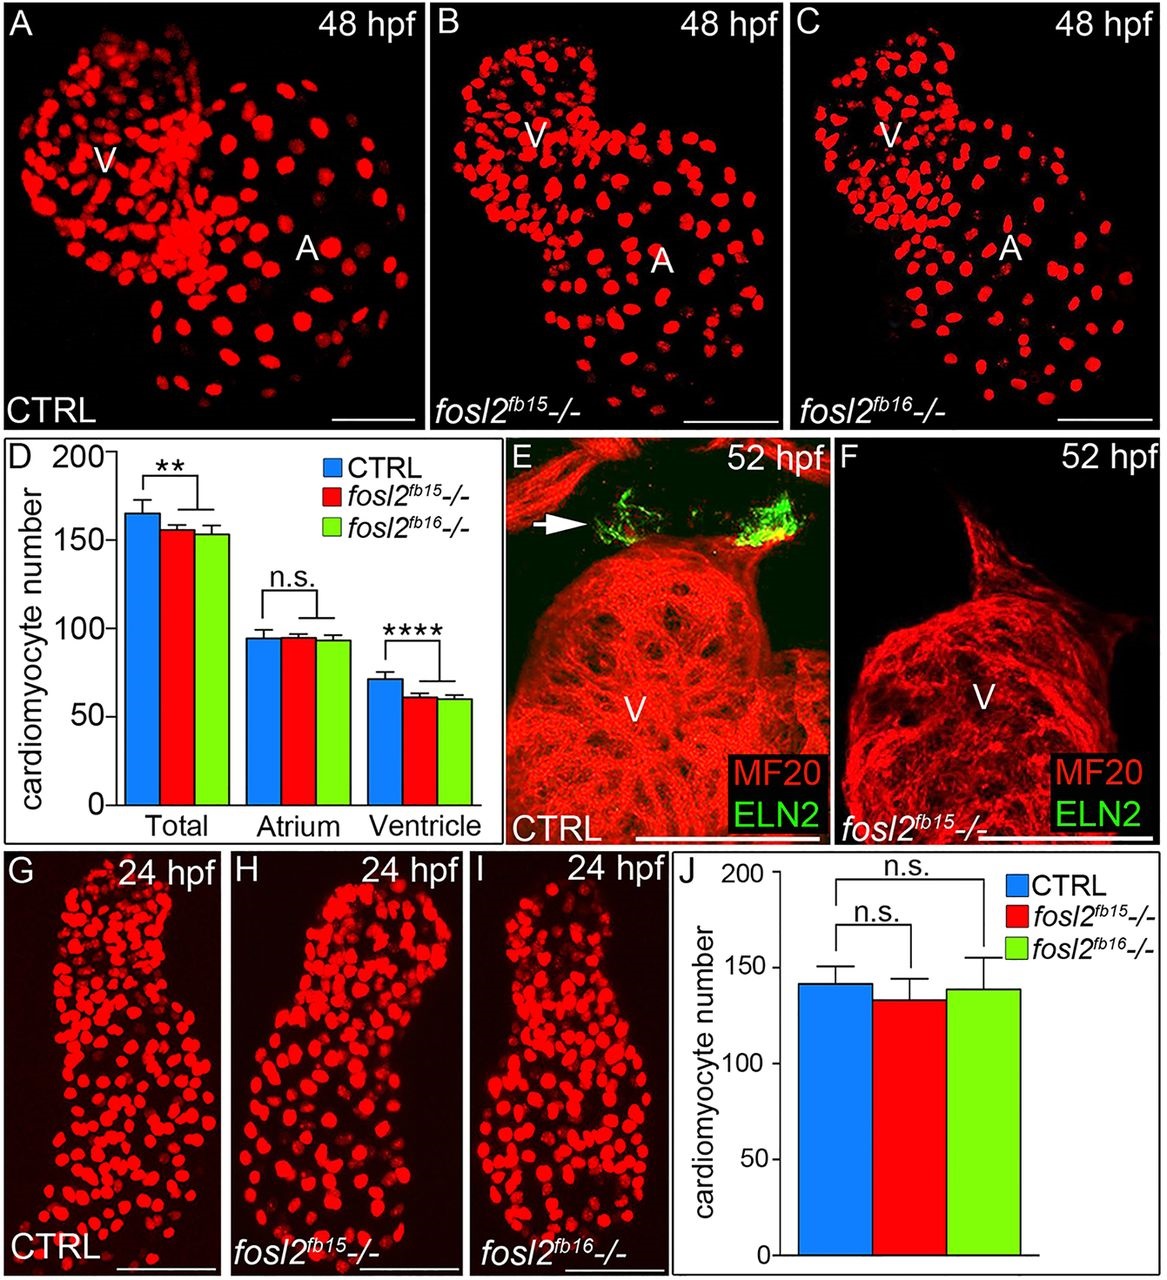
Fig. 2
A ventricular cardiomyocyte deficit emerges in fosl2 mutant embryos after unperturbed linear heart tube morphogenesis. (A-C) Confocal images of fluorescent cardiomyocyte nuclei in hearts of 48hpf control sibling (CTRL; A; n=11), fosl2fb15-/- (B; n=5) and fosl2fb16-/- (C; n=5) Tg(cmlc2:DsRed2-nuc) embryos. (D) Bar graph showing mean total, atrial and ventricular cardiomyocyte numbers in each experimental group. Error bars represent s.d. **P<0.01, ****P<0.0001, n.s., not significant. (E,F) Confocal images of ventricular and outflow tract (OFT) regions of 52hpf control (E; n=10) and null mutant (F, n=4) embryos co-stained with antibodies recognizing striated muscle (MF20, red) or OFT smooth muscle (Elastin2, ELN2, green, arrow in E). (G-I) Confocal images of fluorescent cardiomyocyte nuclei in linear heart tubes of 24hpf control (G; n=12), fosl2fb15-/- (H; n=5) and fosl2fb16-/- (I; n=5) Tg(cmlc2:DsRed2-nuc) embryos. (J) Bar graph showing mean cardiomyocyte numbers in each experimental group at 24hpf. Error bars represent s.d. n.s., not significant. V, ventricle. A, atrium. Scale bars: 50�m.