
Image
|
Figure Caption
Fig. 4
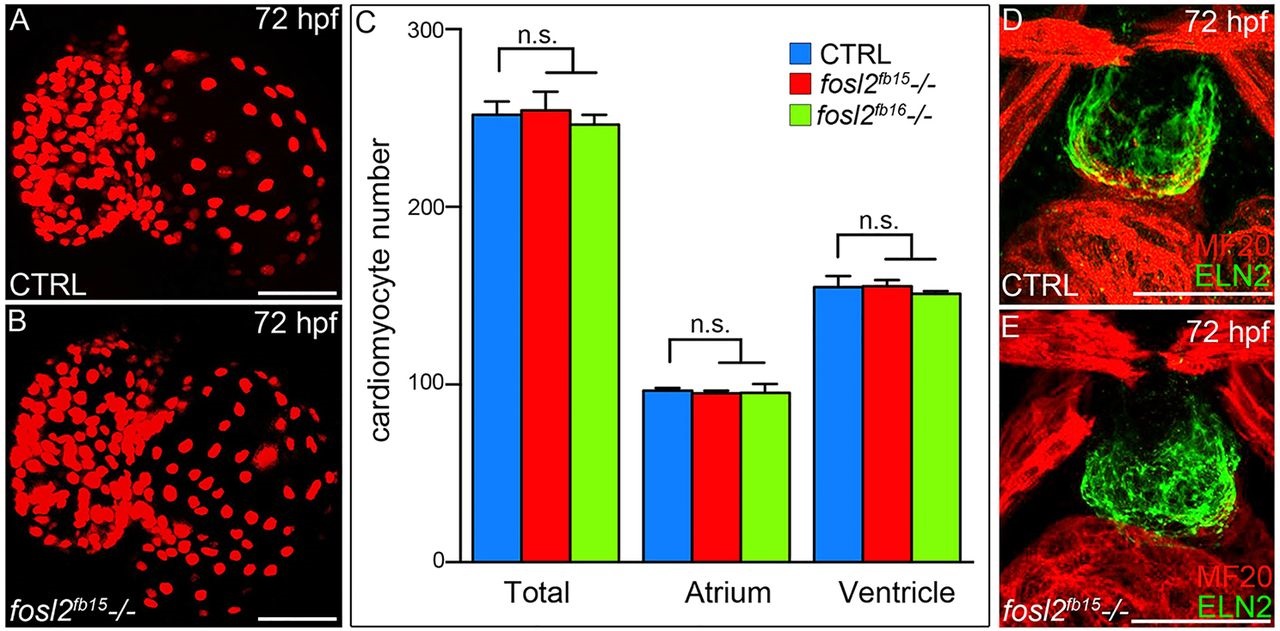
fosl2 mutants recover from their ventricular deficit. (A,B) Confocal images of hearts from 72hpf control sibling (CTRL; A; n=12) and fosl2 (B; n=5) mutant Tg(cmlc2:DsRed2-nuc) embryos. (C) Bar graph showing the mean numbers of total, atrial and ventricular cardiomyocytes in control, fosl2fb15-/- and fosl2fb16-/- (n=3) embryos. Error bars represent s.d. n.s., not significant. (D,E) Confocal images of OFT regions in control (D; n=15) and fosl2 mutant (E; n=4) embryos co-stained with antibodies recognizing striated muscle (MF20, red) or OFT smooth muscle (Elastin2, ELN2, green). Scale bars: 50�m.
Figure Data
Acknowledgments
This image is the copyrighted work of the attributed author or publisher, and
ZFIN has permission only to display this image to its users.
Additional permissions should be obtained from the applicable author or publisher of the image.
Full text @ Development