
Image
|
Figure Caption
Fig. 1
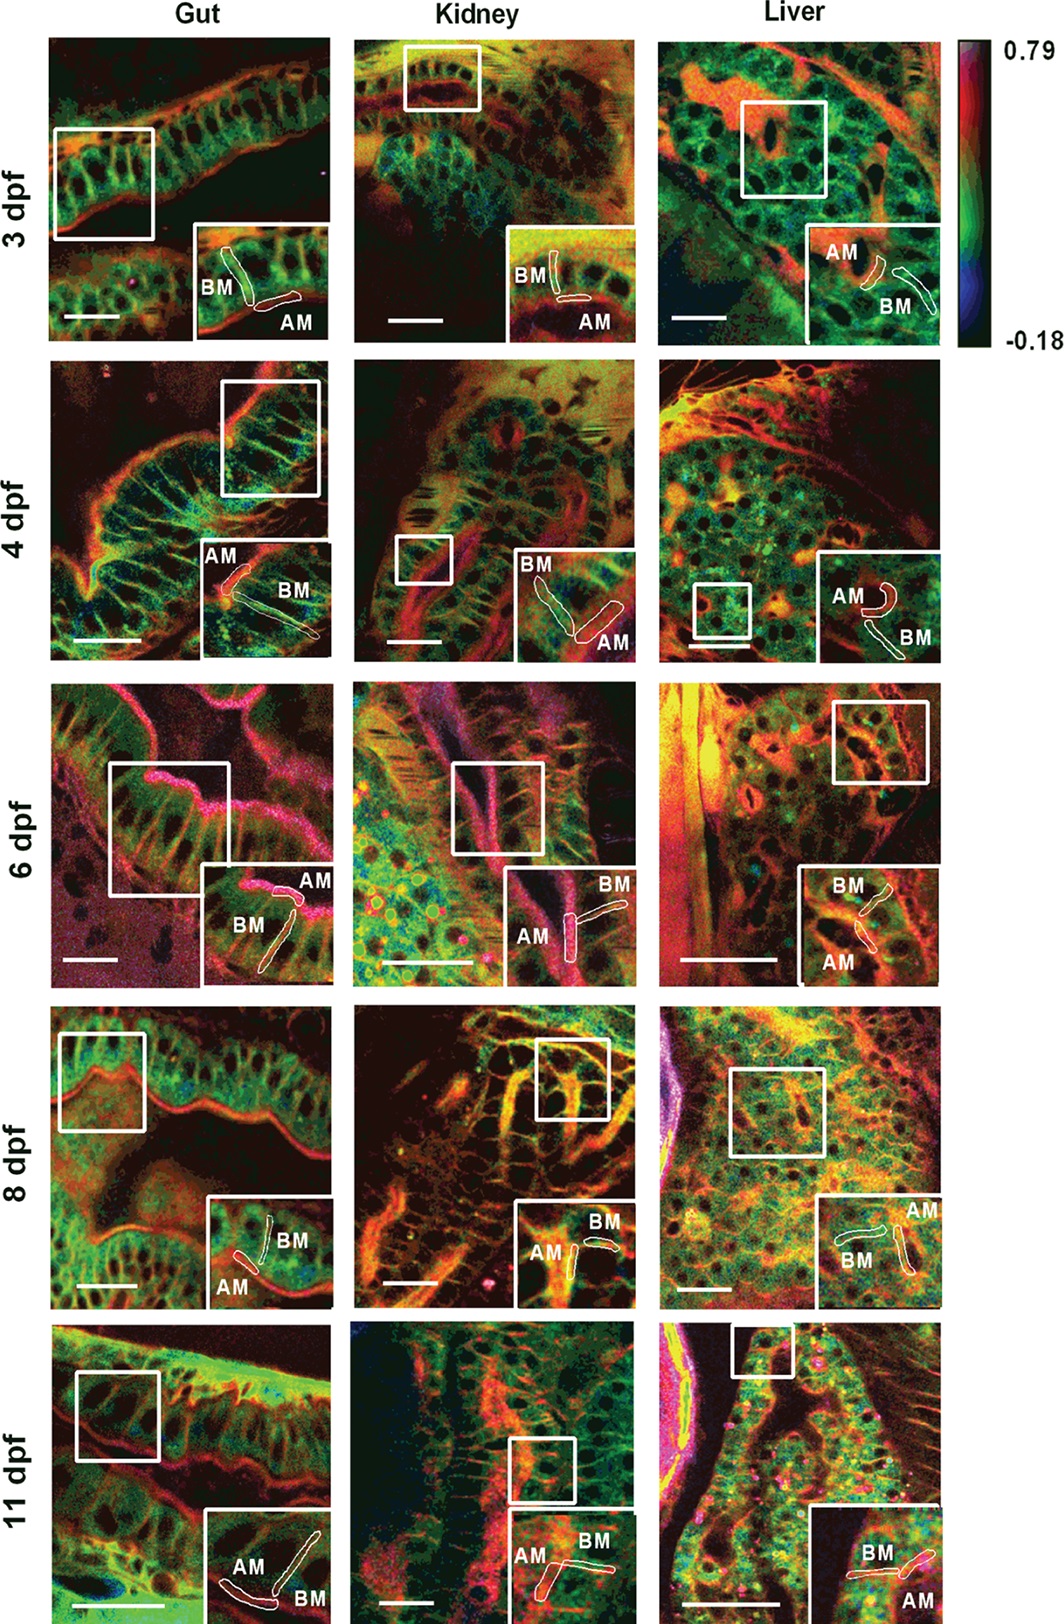
GP images of zebrafish gut, kidney and liver at different development stages. At 3–11 dpf, zebrafish larvae were stained with Laurdan, intensity images of the gut, kidney and liver recorded with a 2-photon microscope and the images converted to GP images. GP images were pseudo-colored with red indicating ordered membranes with high GP values and blue indicated fluid membranes with low GP values as per color scale. Apical (AM) and basolateral (BM) membranes were identified from the tissue morphology as shown in the zoomed regions (white squares). Scale bar = 20 µm.
Acknowledgments
This image is the copyrighted work of the attributed author or publisher, and
ZFIN has permission only to display this image to its users.
Additional permissions should be obtained from the applicable author or publisher of the image.
Full text @ Traffic