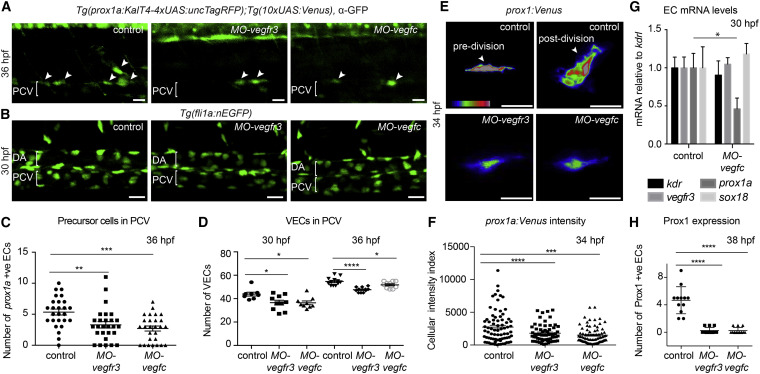
Fig. 5
Vegfc Signaling Is Necessary for VEC Proliferation and Prox1 Expression
(A) Maximum intensity projection of prox1a:Venus (α-GFP, green) at 36 hpf in control, MO-vegfr3, and MO-vegfc embryos in LEC precursors (arrowheads). PCV, posterior cardinal vein.
(B) Maximum intensity projection of Tg(fli1a:nEGFP) at 30 hpf in control, MO-vegfr3, and MO-vegfc embryos across two somites in the posterior cardinal vein (PCV). DA, dorsal aorta.
(C) Quantification of the number of prox1a positive LEC precursors (mean ± SEM) in MO-vegfr3- (n = 27) and MO-vegfc-injected (n = 27) embryos compared to controls (n = 26). Asterisks indicate significance (ANOVA p = 0.0456, p < 0.0001).
(D) Quantification of VEC number at 30 and 36 hpf in Tg(fli1a:nEGFP) in control (n = 8, n = 12), MO-vegfr3 (n = 10, n = 11) and MO-vegfc (n = 9, n = 10; mean ± SEM). Asterisks indicate significance (ANOVA p = 0.0165, p = 0.0168).
(E) Fluorescence intensity of prox1a:Venus in confocal projections of lymphatic precursors in MO-vegfr3 and MO-vegfc embryos compared with control cells pre- and post-division.
(F) Quantification of prox1a:Venus average intensity per pixel in individual MO-vegfr3 (n = 62), MO-vegfc (n = 76), and control precursor cells (n = 75; mean ± SEM). Asterisks indicate significance (ANOVA p = 0.0058, p < 0.0001).
(G) mRNA expression of kdr, vegfr3, prox1a, and sox18 in FACS EC populations from control and MO-vegfc embryos at 30 hpf. Graph represents gene expression relative to kdrl from three biological repeats (mean ± SEM).
(H) Number of Prox1-protein-positive EC nuclei at 38 hpf in MO-vegfr3 (n = 12), MO-vegfc (n = 12), and control precursor cells (n = 12; mean ± SEM) scored across six somites. Asterisks indicate significance (ANOVA p < 0.0001).

