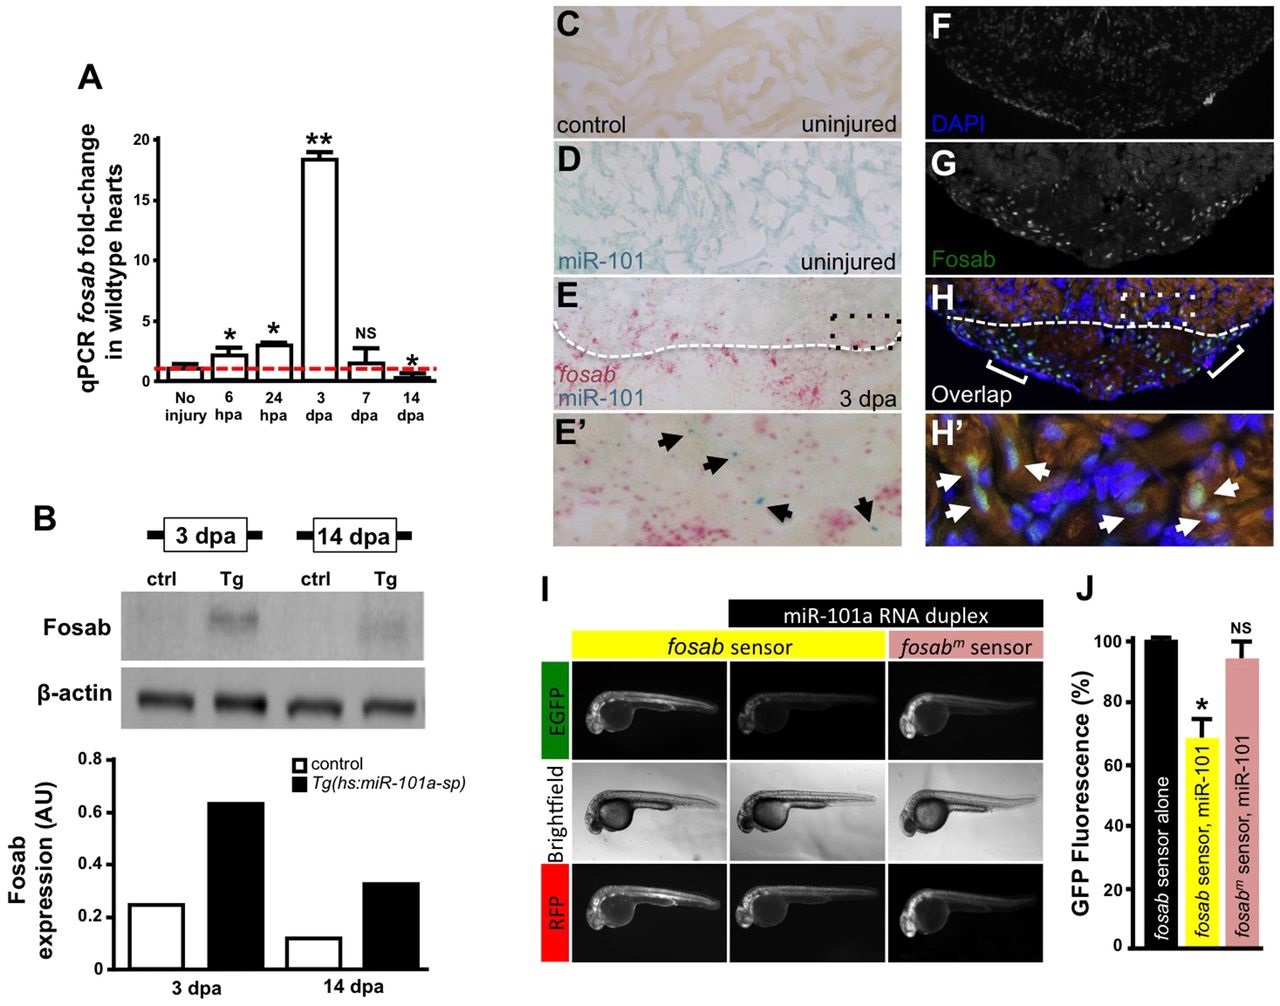
Fig. 6
miR-101a controls fosab activity through interactions at the 3′-UTR. (A) qRT-PCR studies show dynamic fosab expression during a time course of normal heart regeneration. (B) Western blots show increased Fosab protein expression in Tg(hs:miR-101a-sp) ventricles at 3 and 14dpa relative to controls. Graph shows quantification of western blots using ImageJ software and normalized to β-actin. (C-E′) RNA in situ hybridization studies to detect miR-101a (blue) and fosab (red) in uninjured and 3dpa regenerating hearts. miR-101a expression is restricted to CMs in uninjured hearts, whereas fosab expression is enriched in CMs at the border zone and non-muscle cells of the wound environment at 3dpa. (F-H′) Antibody staining to detect Fosab protein expression confirms RNA in situ hybridization expression patterns. E′ and H′ are magnified images of boxed areas in E and H; arrowheads mark miR-101a (E′) and Fosab (H′) expression in CMs; brackets in H2 indicate Fosab in the microenvironment. (I,J) mRNA EGFP-fosab-3′-UTR sensor assays reveal ~30% decrease in fosab expression when the sensor is co-injected with miR-101a RNA duplex, relative to EGFP-fosab-3′-UTR sensor injection alone. This miR-101a regulation of fosab is abolished in response to a three-nucleotide mutation of the predicted miR-101a binding site (fosabm sensor). n=6-8 embryos per treatment; *P<0.05, **P<0.001 (Student′s t-test); NS, not significant; error bars represent s.e.m.

