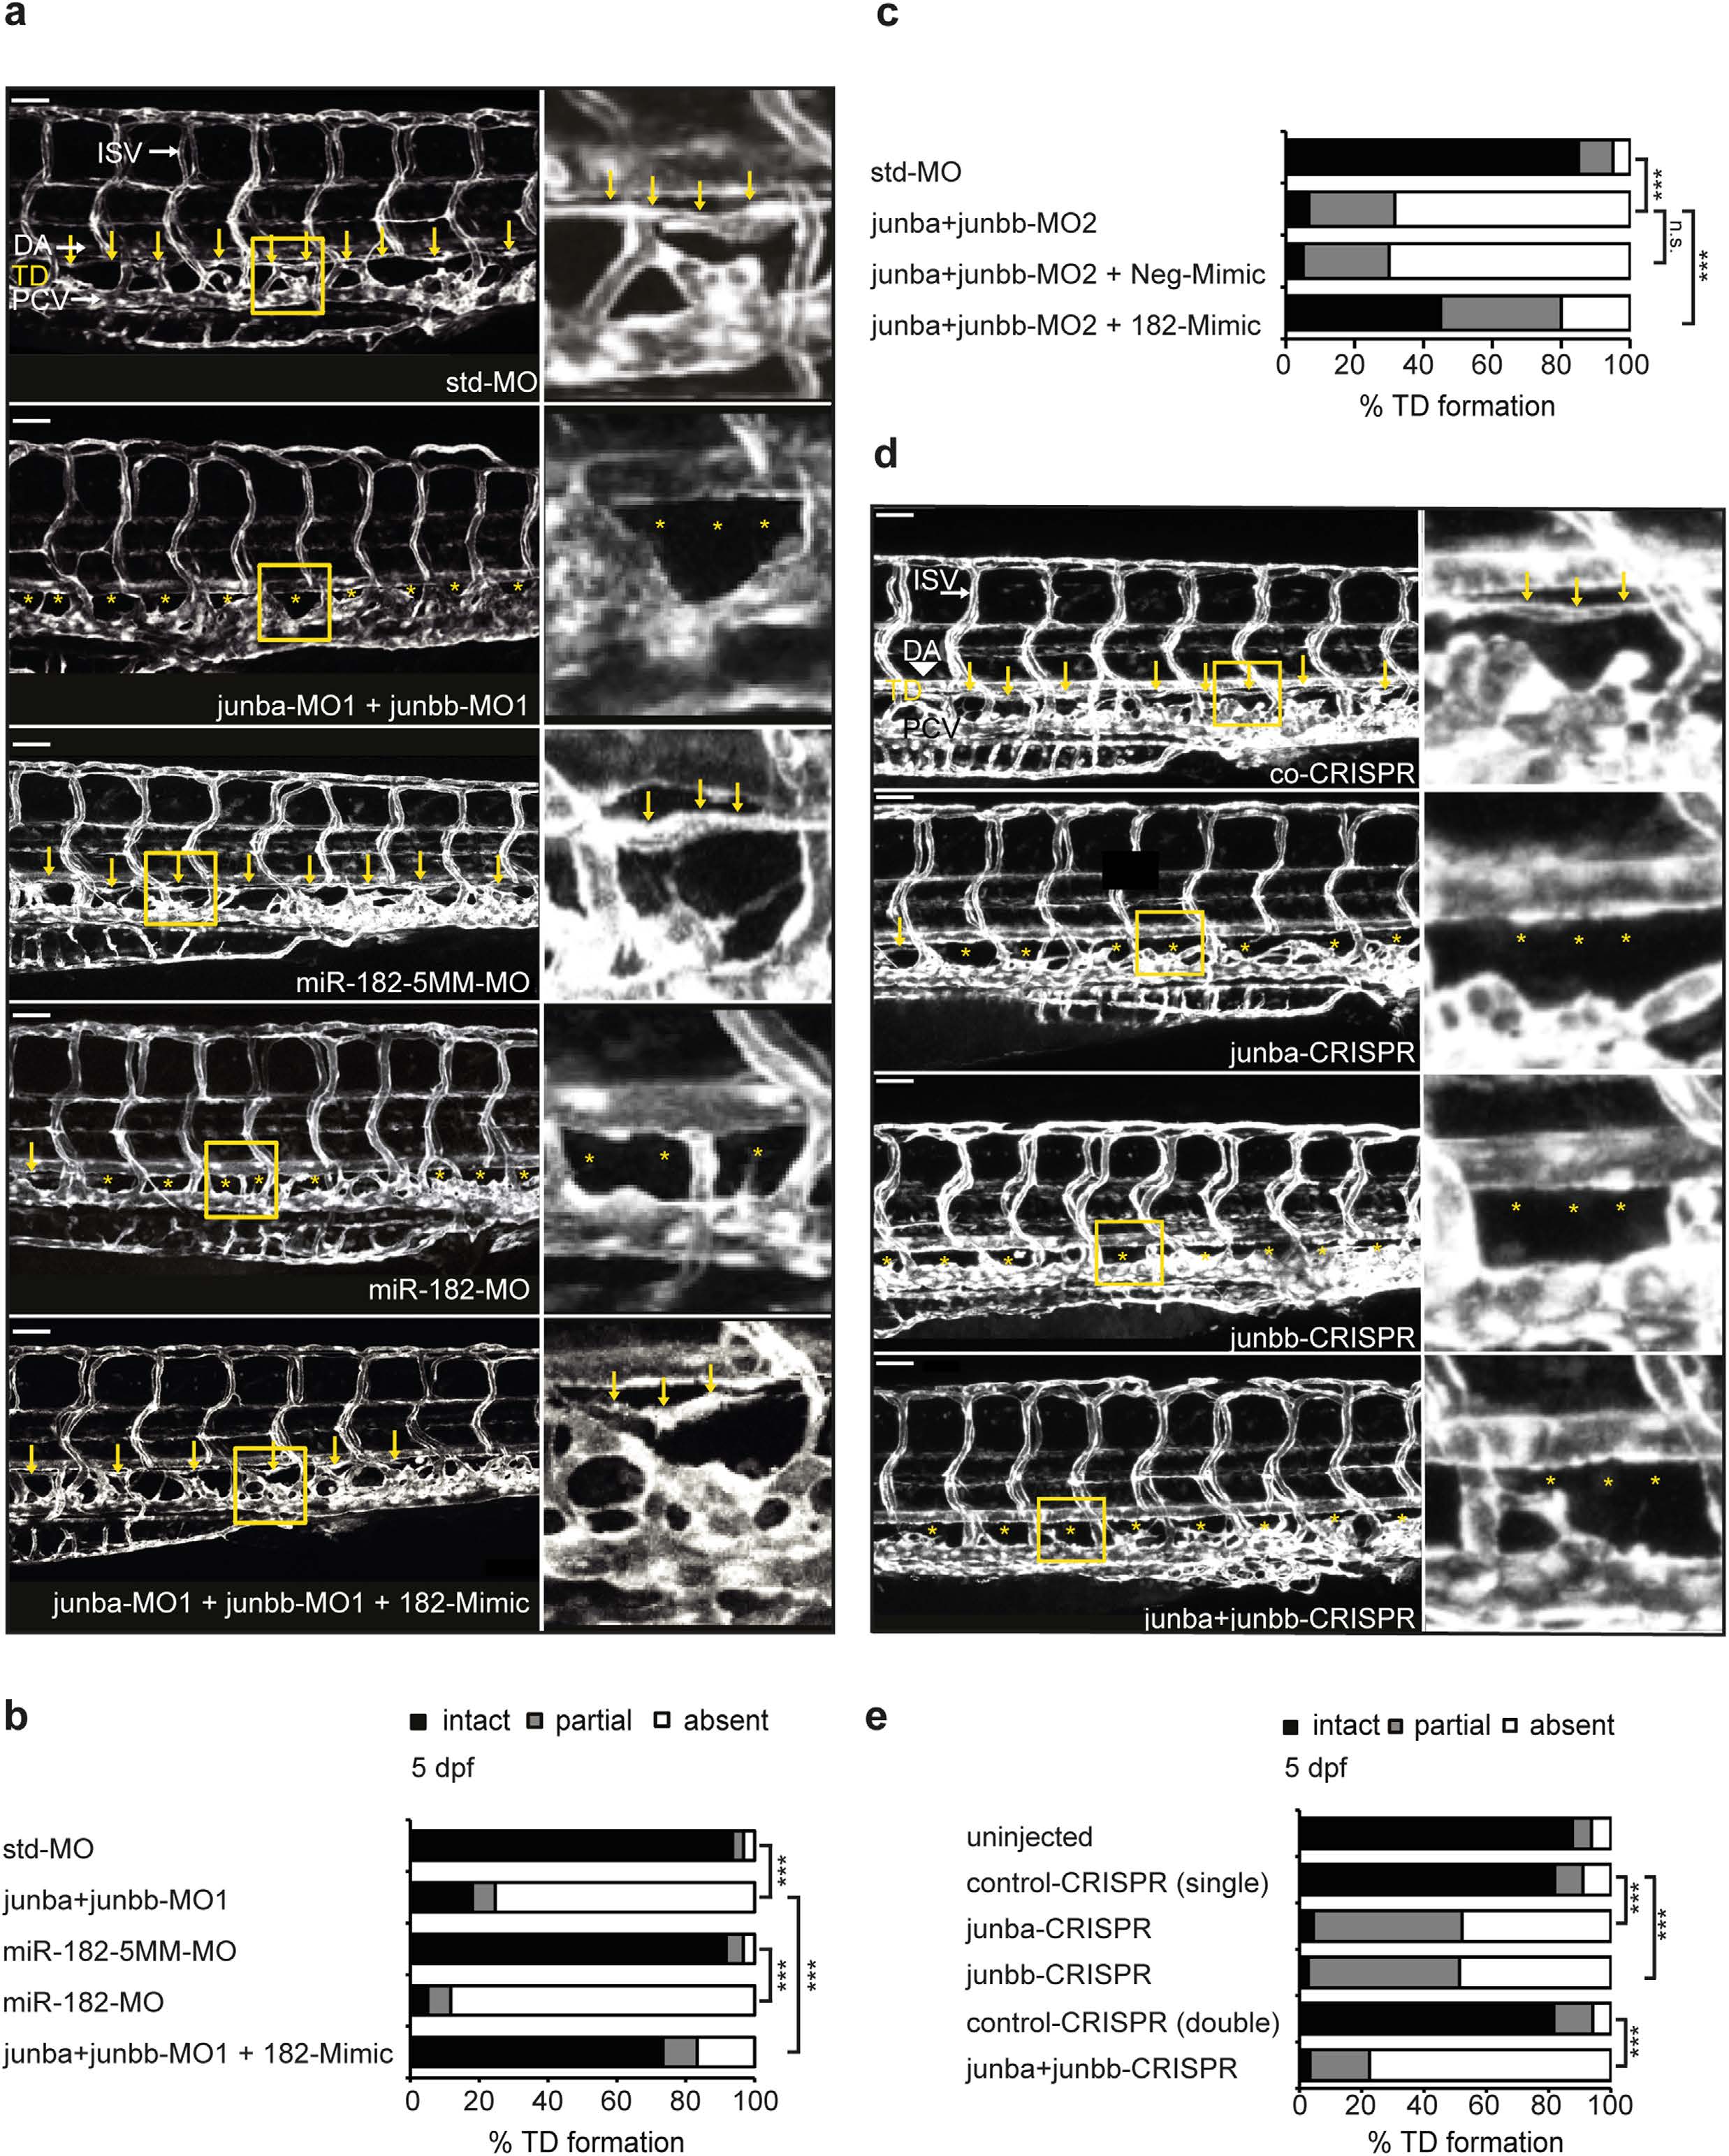
Fig. 6 Failure in TD formation of Junb morphants is restored by ectopic miR-182.
(a) Left panel, confocal images of trunk vasculature of representative larvae at 5 dpf injected with indicated morpholino or mimic: std-MO (4 ng, n = 62), junba-MO1 + junbb-MO1 (2 ng + 2 ng, n = 60), miR-182-5MM-MO (12 ng, n = 59), miR-182-MO (12 ng, n = 60), junba-MO1 + junbb-MO1 + 182-Mimic (2 ng + 2 ng + 40 pg, n = 32). Middle panel, confocal images of indicated trunk region. Right panel, enlarged view of trunk region marked by yellow rectangle in the middle panel. TD is located between dorsal aorta (DA) and posterior cardinal vein (PCV) and is marked with yellow arrows or if absent with asterisks. Panels are lateral view; dorsal is up, anterior to the left. White scale bar: 50 Ám. (b,c) Percentage of TD defects in larvae for the first (b) and the second set of junb-MOs (c). (d) Left panel, confocal images of trunk vasculature of representative larvae at 5 dpf CRISPR gRNA-injected larvae with indicated junb-CRISPR gRNAs or control CRISPR gRNA: junba-CRISPR (250 pg gRNA), junbb-CRISPR (250 pg gRNA), junba-CRISPR + junbb-CRISPR (200 pg + 200 pg gRNA) and Co-CRISPR (400 pg gRNA). Labelling and size bar as described in (a). (e) Percentage of TD defects in larvae at 5 dpf injected with CRISPR gRNAs either against junba, junbb or a combination of both versus larvae injected with control CRISPR gRNA. Sum of 10 somite segments per embryo was categorized into groups with presence, partial or complete absence of TD. ***P < 0.001, Mann-Whitney U-test.

