
Image
|
Figure Caption
Fig. S1
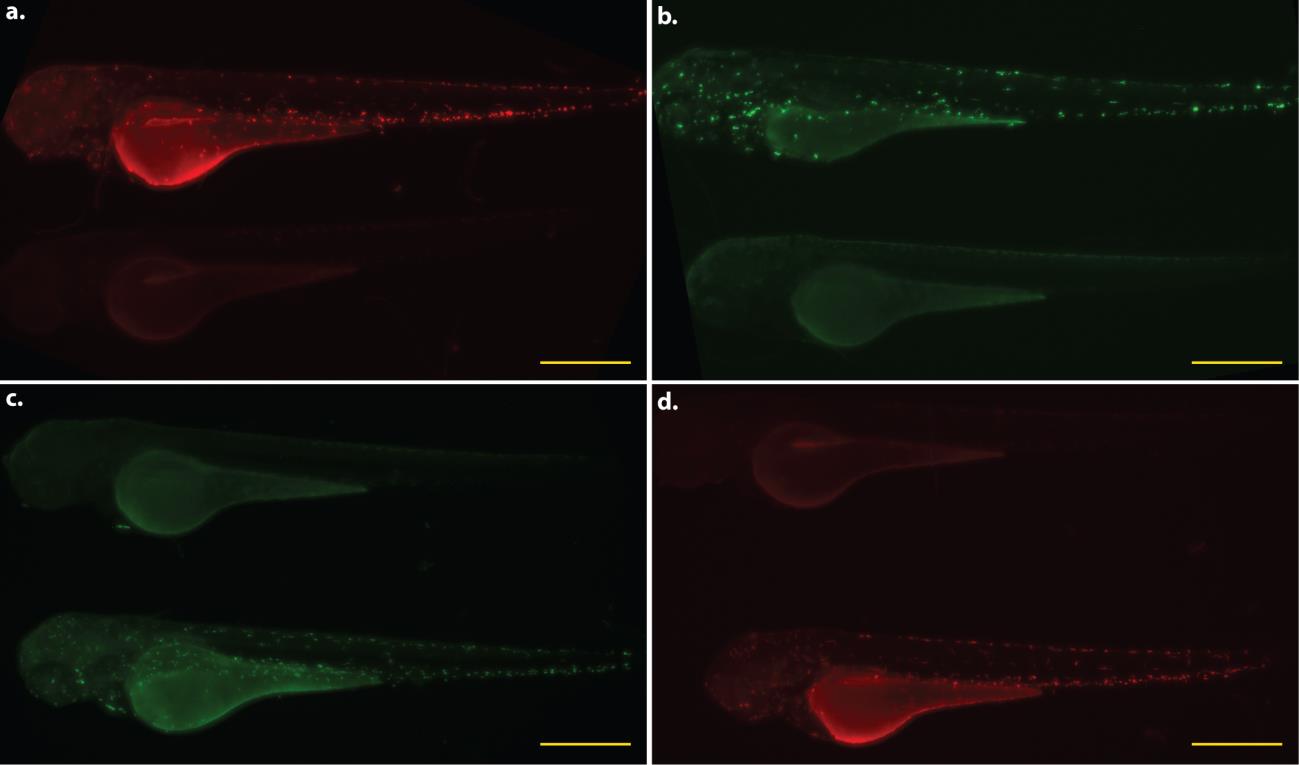
Whole animal expression pattern of mfap4 transgenic lines.
All larvae shown are 3 dpf. Each panel pairs a representative transgenic animal with a non-transgenic animal to provide a direct comparison of background fluorescence in the relevant excitation/emission channel. a. Tg(mfap4:tdTomato)xt12. b. Tg(β-actin2:loxP-DsRed-STOP-loxP-EGFP)s928 X Tg(mfap4:iCre:p2A-tdTomato)xt8. c. Tg(mfap4:dLanYFP-CAAX)xt11. d. Tg(mfap4:tdTomato- CAAX)xt6. Scale bars = 500 µm.
Acknowledgments
This image is the copyrighted work of the attributed author or publisher, and
ZFIN has permission only to display this image to its users.
Additional permissions should be obtained from the applicable author or publisher of the image.
Full text @ PLoS One