
|
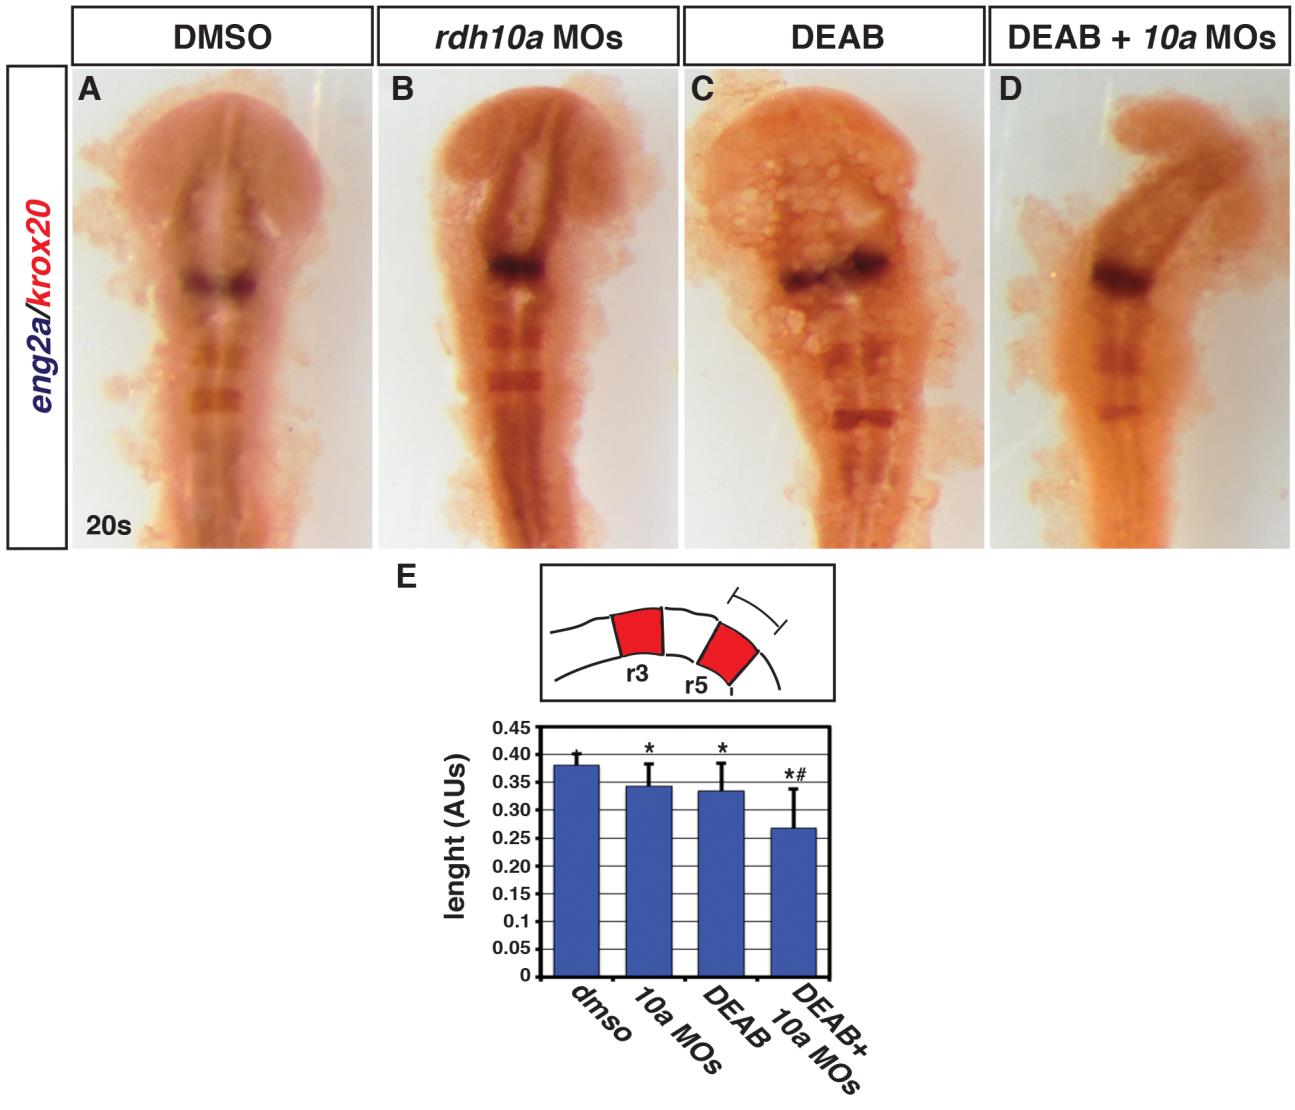
Fig. S4 Functional interaction between Rdh10a depletion and Aldh1a2 inhibition in the hindbrain.
(A-D) ISH for eng2a (blue), which marks the midbrain-hindbrain boundary, and egr2b (red), which marks rhombomeres (r) 3 and 5. Control DMSO treated (n = 13), Rdh10a deficient embryos (n = 13), 0.05 �M DEAB treated (n = 12), and Rdh10a deficient + 0.05 �M DEAB embryos (n = 14). (E) Schematic and measurements of r5 length in arbitrary units (AU). Asterisks indicate a statistical significant difference between embryos treated with the DMSO versus all the other conditions. Hashtag indicates a statistically significant difference between embryos injected with rdh10a MOs or treated with DEAB versus the embryos treated with DEAB and injected with rdh10a MOs.